Trading higher, trading lower, and the important levels between. A scenario-led map for the week ahead.
IN THIS EDITION
Strength is constructive.
Confirmation is still the job.
The Higher-Timeframe Read
01 / MARKET CONTEXTFriday’s liquidation took ES below its former all-time high at 7043 and left it just above the 2026 RTH and ETH opens at 6927.75 and 6901. That’s substantial technical damage. But for all the ground sellers covered, they left relatively little volume behind. From hereon, I want to see whether sellers can spend time and build value below 7043, or whether the next push lower fails and gives buyers their first real opening in more than a week.
ES has returned to this year’s lower distribution. The low-to-mid 7300s marked the lower edge of the upper distribution and were the last area to see appreciable volume during the selloff. If time and volume start building below 7043, especially in successive distributions at lower prices, sellers will have a stronger case for continuation. A sustained reclaim of 7043 would be the first technical repair, with the former June RTH low at 7247 next. 7305-7317 is the first reclaim that would meaningfully challenge the broader breakdown.
What Would Confirm a Swing Low?
Since November 11, RTH buyers haven’t initiated above a prior day’s high, even after an overnight gap higher. I want to see buyers take out a prior day’s high during the regular session to bring the daily timeframe into balance. Friday’s high is the current upper boundary of that prospective balance (a live time away in points to see but possible). An upside break of a hopeful multi-day balance would give me a credible short-term swing low. A sustained reclaim of 7305-7317 would then give that recovery broader structural significance.
A lower-first move could offer a cleaner setup. If ES breaks below the prior day’s low (Friday) and quickly reclaims it, that look below and fail (LBAF) would show initial rejection and give responsive buyers a setup. The next test is whether RTH buyers can follow through above the prior day’s high. An accepted break below last week’s low, with value building underneath, keeps the continuation short in play.
ES Chart
02 / THE DECISION MAP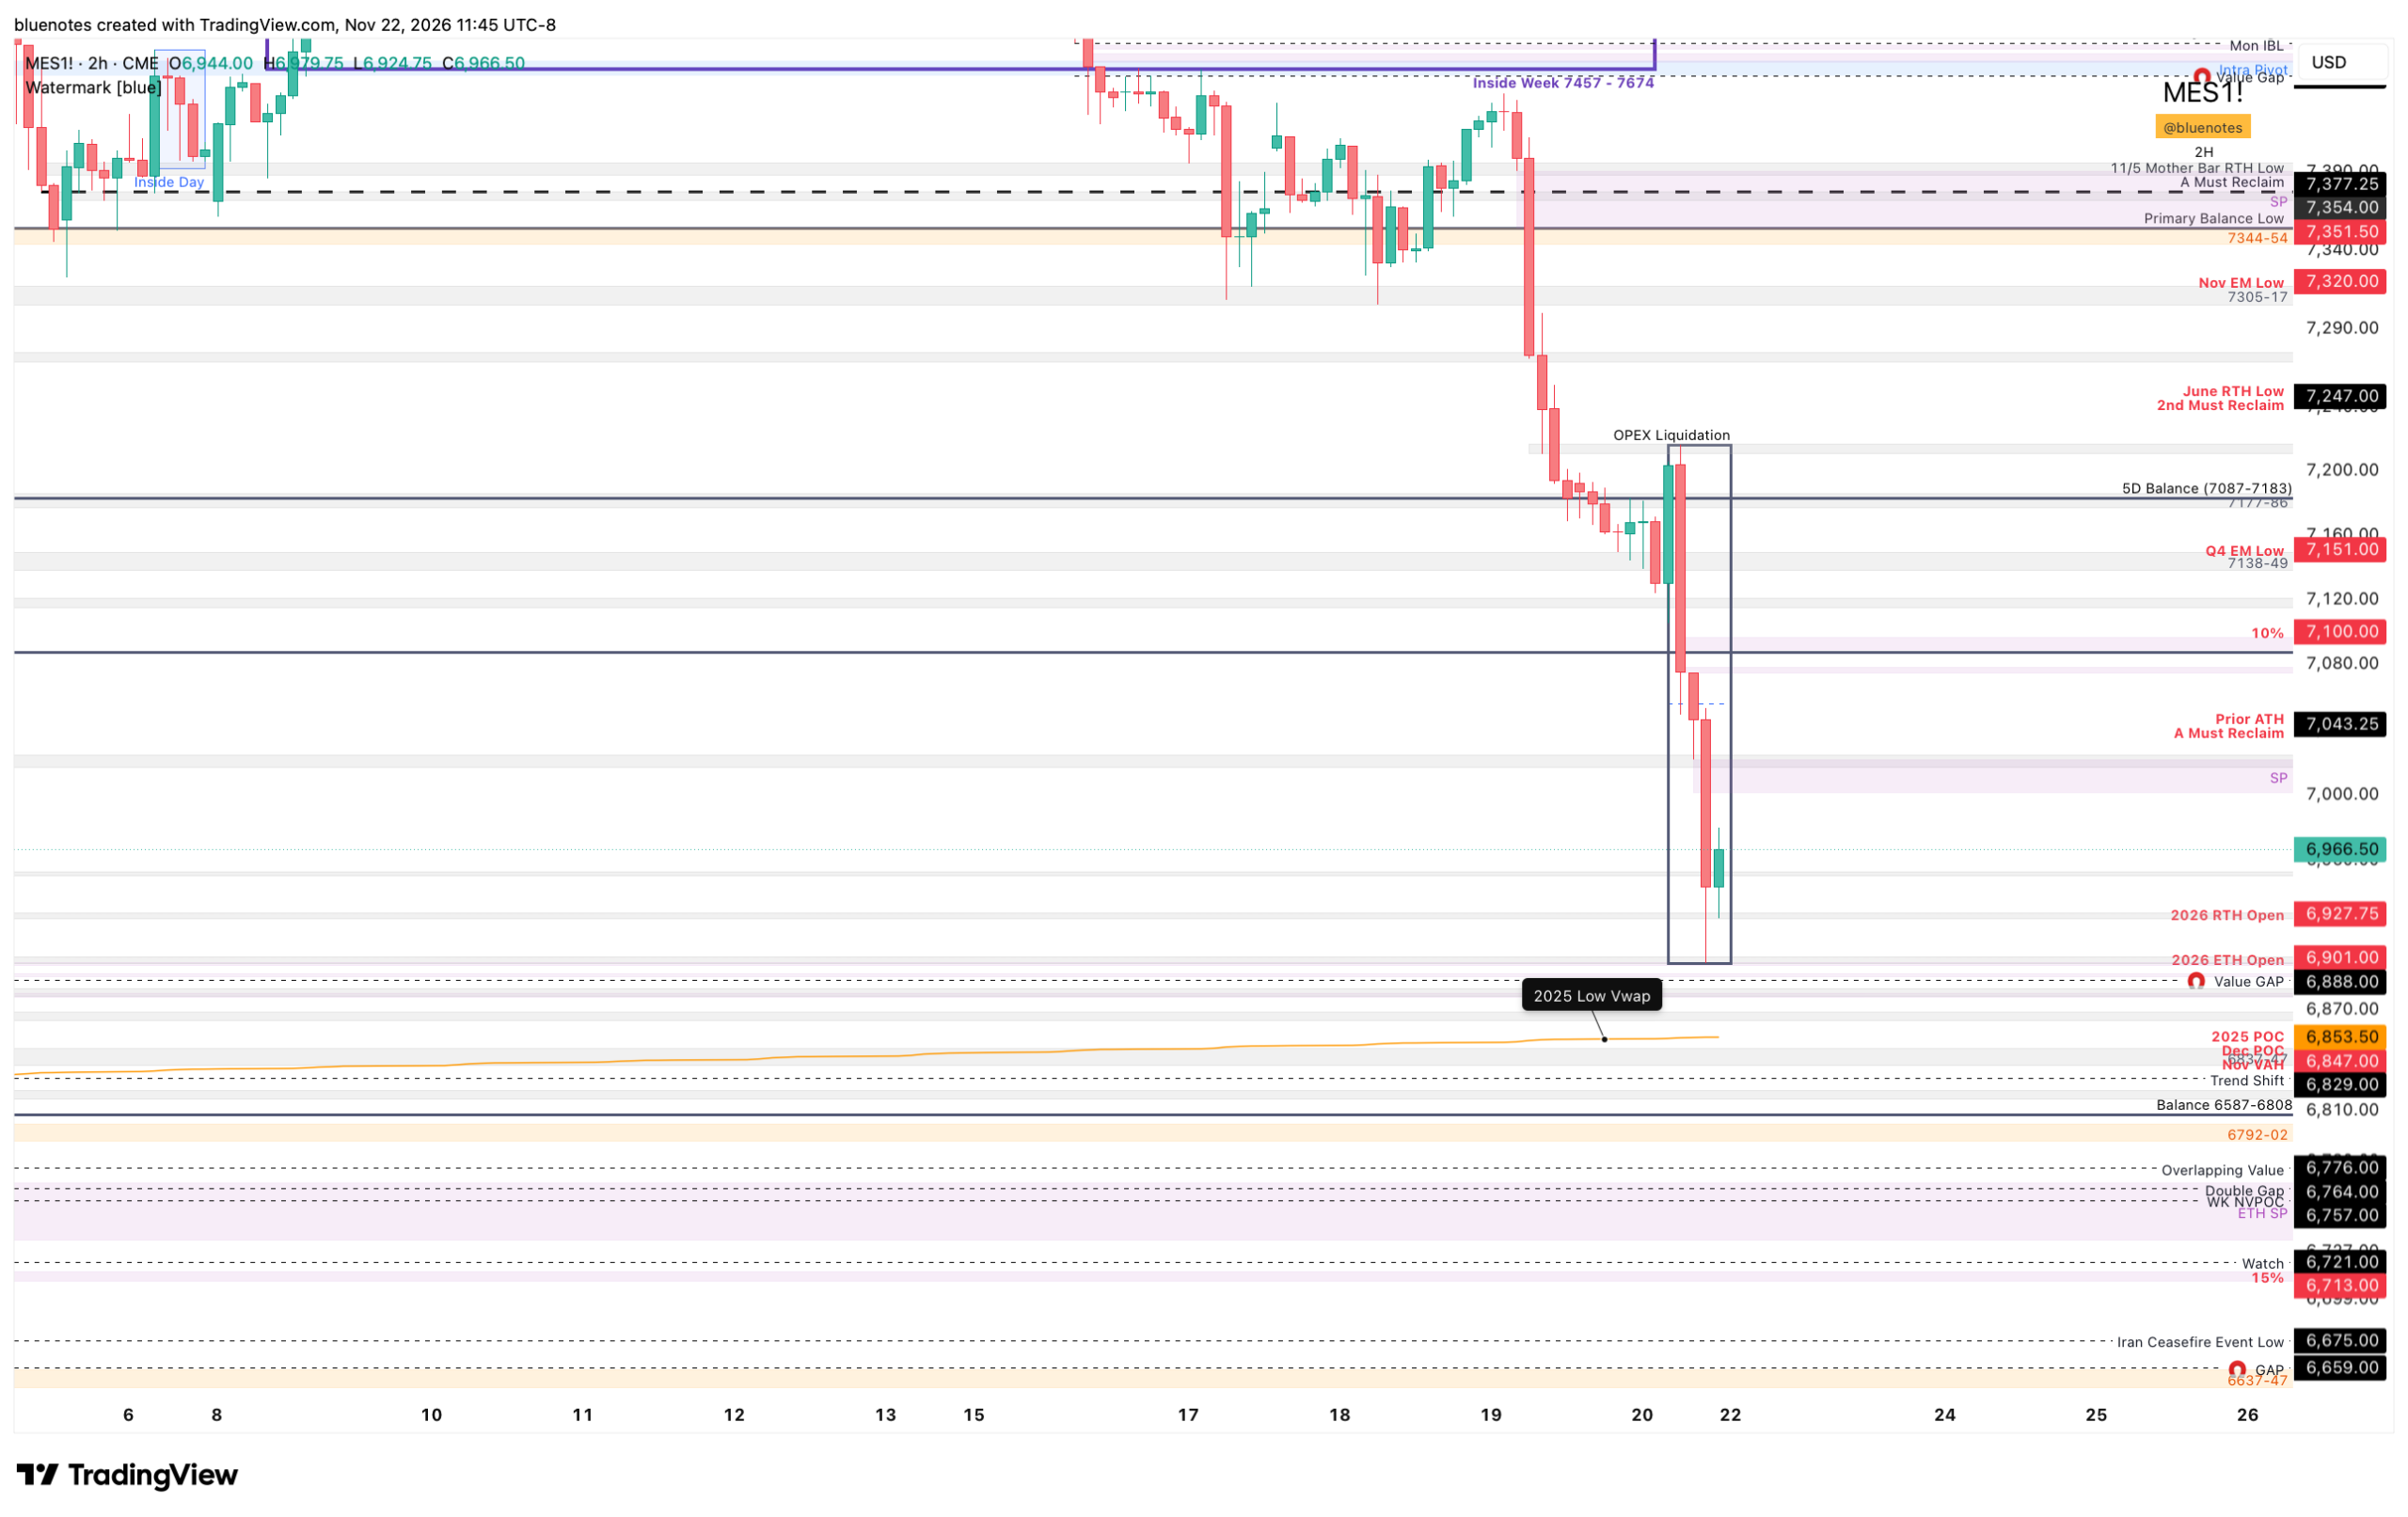
If buyers find their feet
03 / TRADING HIGHER SCENARIOA break above the developing balance and a sustained reclaim of 7305-7317 would put 7372-7377 in play, followed by 7388-7396. Thursday’s B-period single prints at 7354-7390 could make that rotation uneven.
If buyers fail at 7305-7317 I’ll watch for a potential lower daily high. The confirmation would come on a subsequent downside break of the developing multi-day balance.
If sellers press
04 / TRADING LOWER SCENARIO6898-6902 through 6817-6822 is a cluster of weekly support. Demand sits at 6856-6875 and may extend to 6835 near the 2025 low anchored VWAP. I’d be cautious about pressing a short on the first pass through this area. 6817-6822 could mark the deepest backtest of the 7043 breakdown in a higher-timeframe trap, but that setup would first require a reclaim of roughly 7300.
6780 is the upper edge of the unfilled RTH gap down to 6659. Acceptance inside the gap favors a full fill. A quick break and reclaim of 6780 would give responsive buyers a setup while the gap remains open.
Below 6637-6647, I’ll watch 6514-6520 for an LBAF. Acceptance below 6492-6497 brings the 6359.50 year-to-date low into play. That’s well beyond the shortened week’s straddle-implied range, and last week showed how quickly the auction can outrun it.
Patience is key
05 / Final ThoughtsI’m coming into the week with the seller bias intact and two trades in mind. If ES finds acceptance below last week’s low, I’ll favor continuation. If the break fails and price reclaims the low, I’ll look for a responsive long. A violent squeeze can cover a lot of ground in one session. I’ll give a recovery more room once RTH buyers clear the top of the developing balance and hold 7305-7317.