
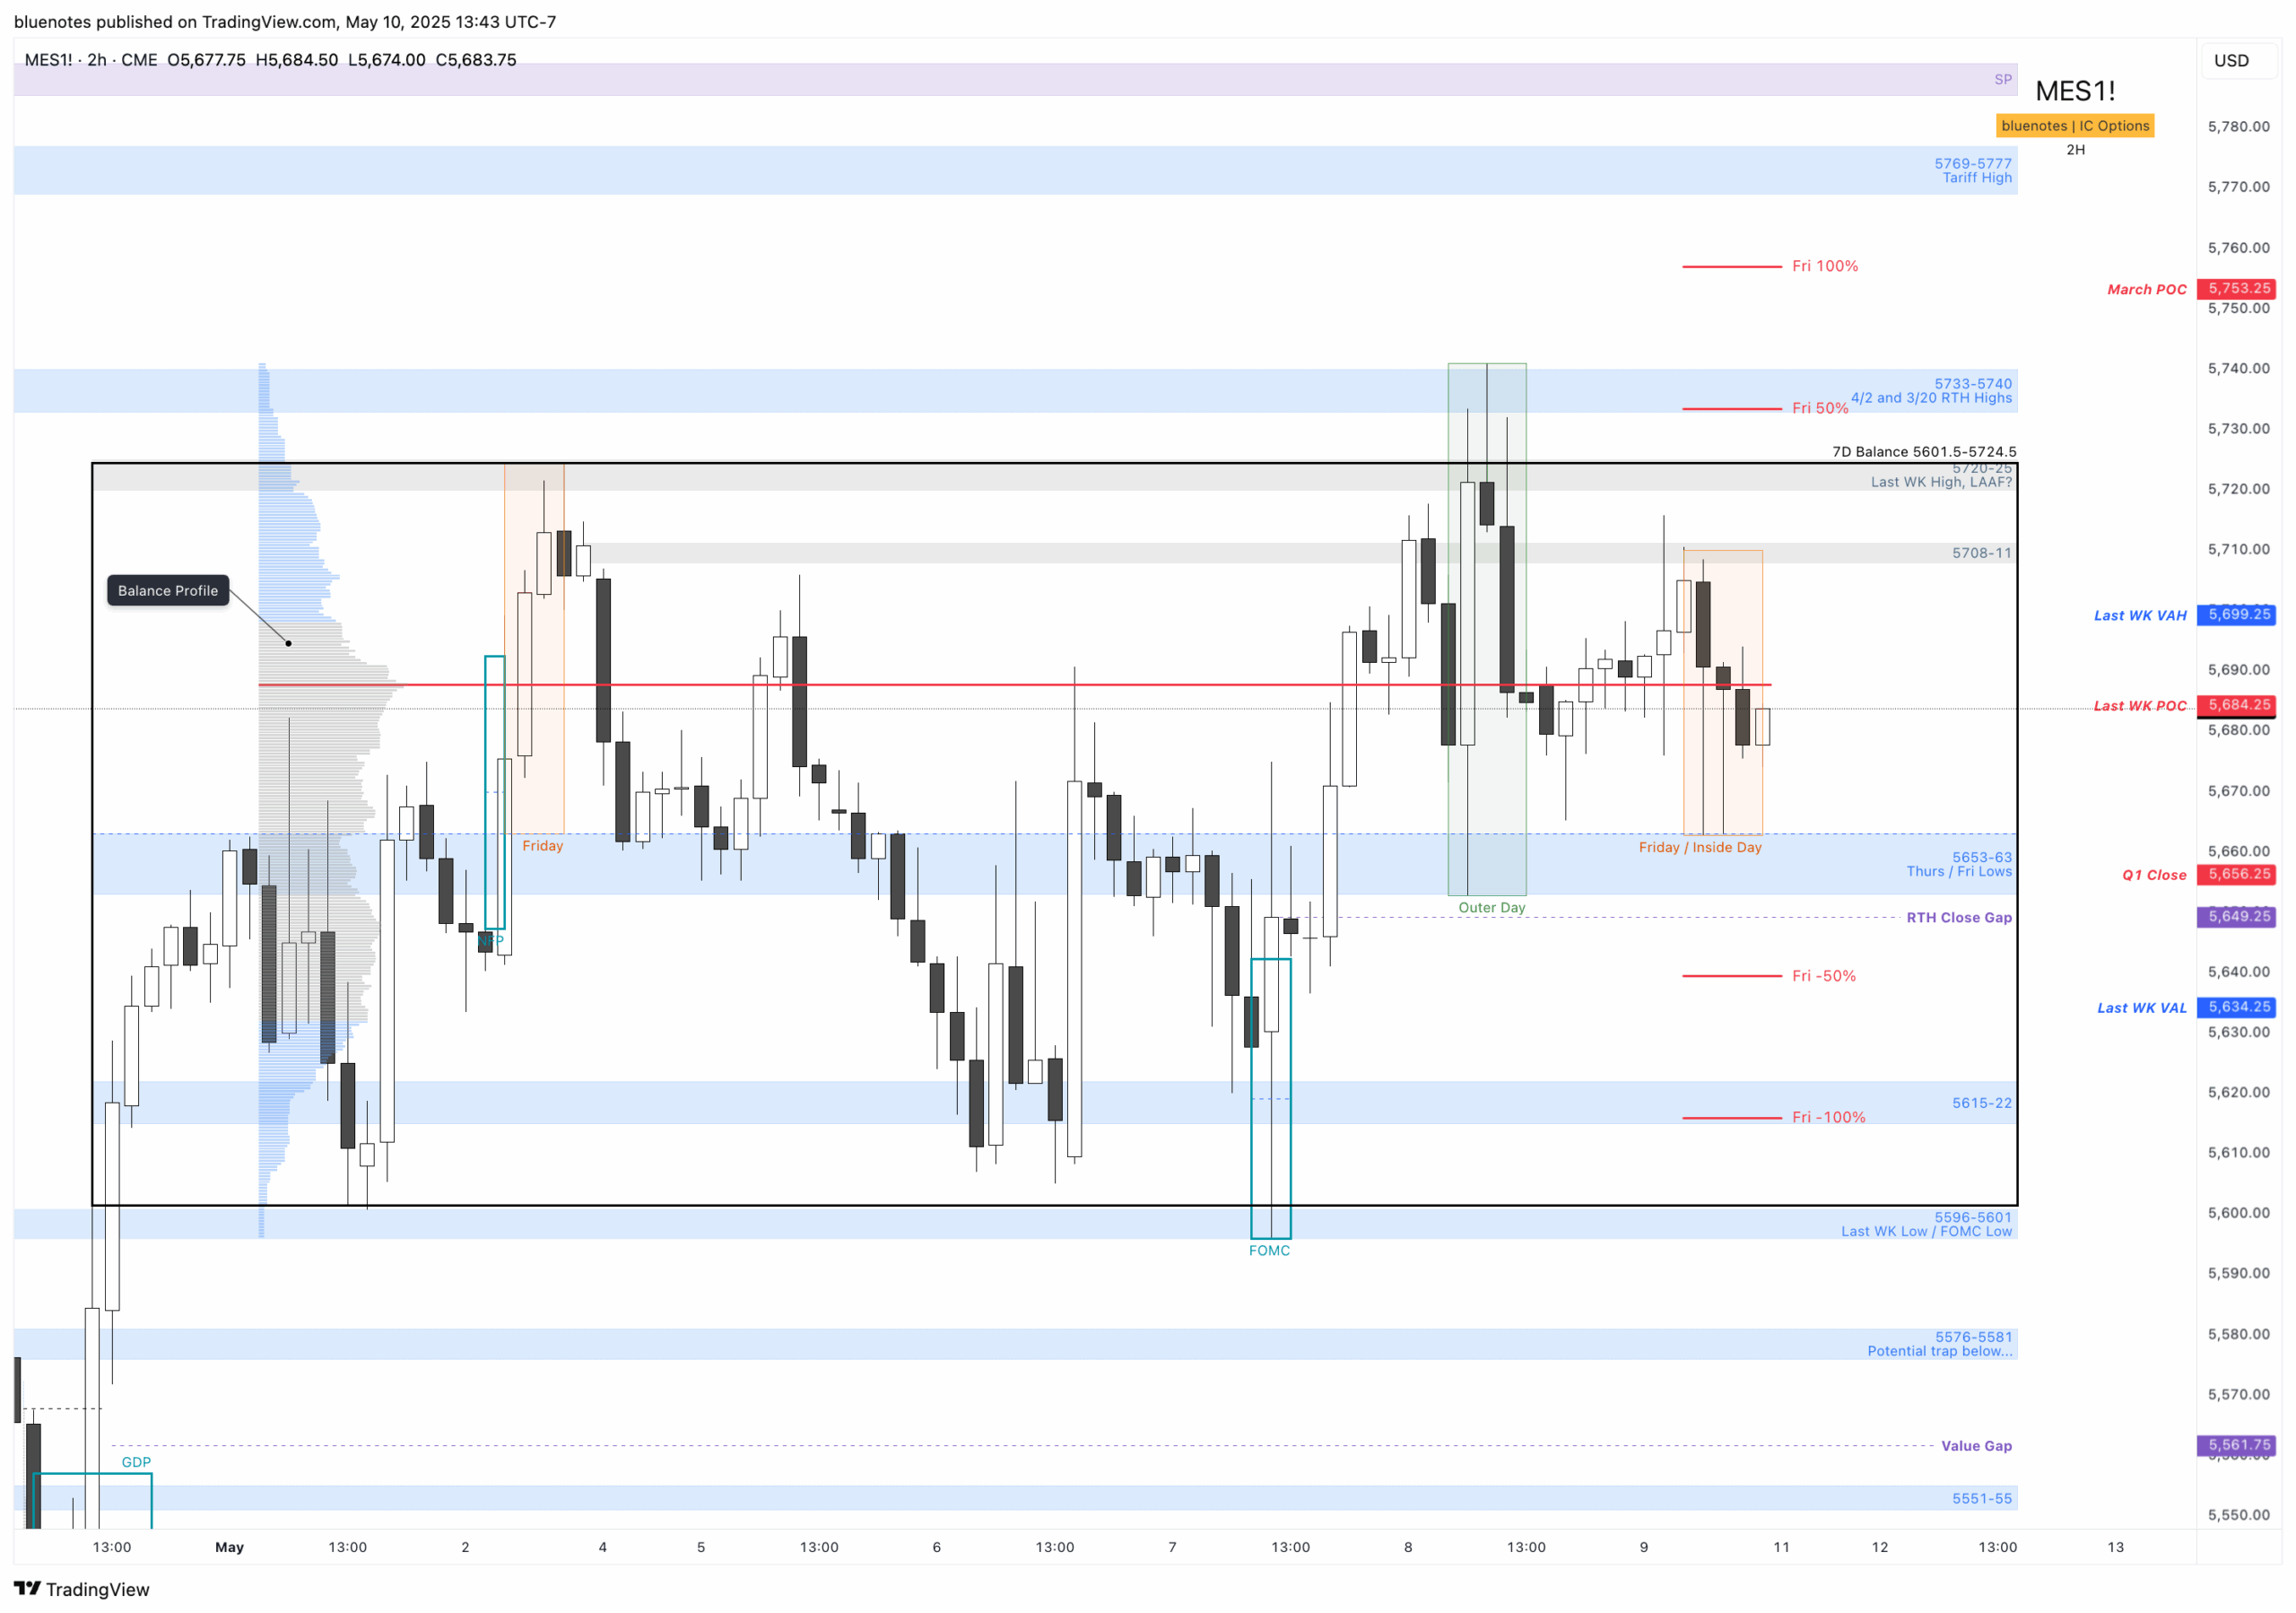
This week we found daily balance with prices pinging between 5596-5601 and 5720-25 / 5733-5740 levels. This is now 7 day balance with Friday closing on the upper half as an inside day. Additionally, this “mini” balance is in the middle of a much larger balance range 5512-5837.
From the prior week’s high we made little progress above and consolidated for the most part above 5653-63. Wednesday’s FOMC event candle gave us a look below and fail of balance which we held until 5720-25 and Tariff day’s RTH high on April 2nd which created a look above and fail of balance. Both ends have been swept and can easily be swept a 2nd time. With balance rules, which produces a look above/below fail, targets the halfback and if continuation, the opposite side of balance. So far, we have a full traverse up and now a reversion down to the halfback. It may or may not complete a rotation to the lower edge from here. We can note a somewhat lower volume area in the middle of the range but its hard to characterize it as a proper “low volume node.” The real move will come following a decisive break of this range. Until then we can continue to generally fade the edges and the failed breaks in particular. I would not be surprised to see yet another failed breakdown or breakout.

If you look at the volume profile, you’ll see the LVN which splits our range along our weekly 5653-63 zone. For this week, that will serve as our early pivot. If price is trapped below that zone, then it can be expected to move towards 5615-22 and potentially to last weeks’ low 5596 (FOMC Low). Holding above the halfback zone would expect 5708-5711, 5720-25 and last week’s high 5741.
My personal lean is on this resolving down, but am fully aware that higher targets are available – specifically the tariff announcement high that was done after hours at 5776.25. Where we are at an area that I will not initiate new swing longs on products that have already moved. Scalps, day trades sure when presented, but will be cautious of any size on the long side. For me to get a strong long bias, I need to see this break above balance move up towards 5800 and backtest and hold 5740-20 making a higher low. From there we can look towards 5880, 5917-35, 5947 (May Expected High falls around here). I would very much prefer us test lower first say 5560’s-5540’s hold the larger balance range and then move higher.
To be honest, there just hasn’t been much conviction from buyers or sellers lately. Even on FOMC day, ES only managed to trade about 1.3 million contracts—not exactly a sign of big moves brewing. So far, I haven’t seen the kind of heavy selling that would point to a major drop, nor have I noticed strong buying that would hint at a breakout rally. At this point, I’d expect a move in either direction to stay within a modest 3–5% range, though that could easily shift depending on headlines and fresh data.
One thing worth noting—NAAIM jumped above 80 this week, the highest we’ve seen since the February peak. NYMO and NAMO have backed off from their more extreme levels, but if the market keeps pushing higher, I’d expect all three to swing right back into overbought territory. It’s pretty fascinating to see NAAIM this elevated while we’re still trading under the 200-day moving average. Personally, I still think a pullback to the 5400–5500 zone would be a healthy reset. If we do get a breakout that keeps going, it may just end up overshooting the 200sma before reversing. Either way, I think we eventually visit that 5400–5500 area—from here, or from a bit higher up.
Live chart: https://www.tradingview.com/chart/f8EEzTyy/