I have a number of private indicators that can be used with TradingView.

Expected Levels
Adds a number of levels and pivots. Used with Crypto, Stocks, and Futures. Levels include previous day high/low, weekly open, ADR, Initial Balance, Opening Range, NY Open, Equilibrium and pivot points and more.
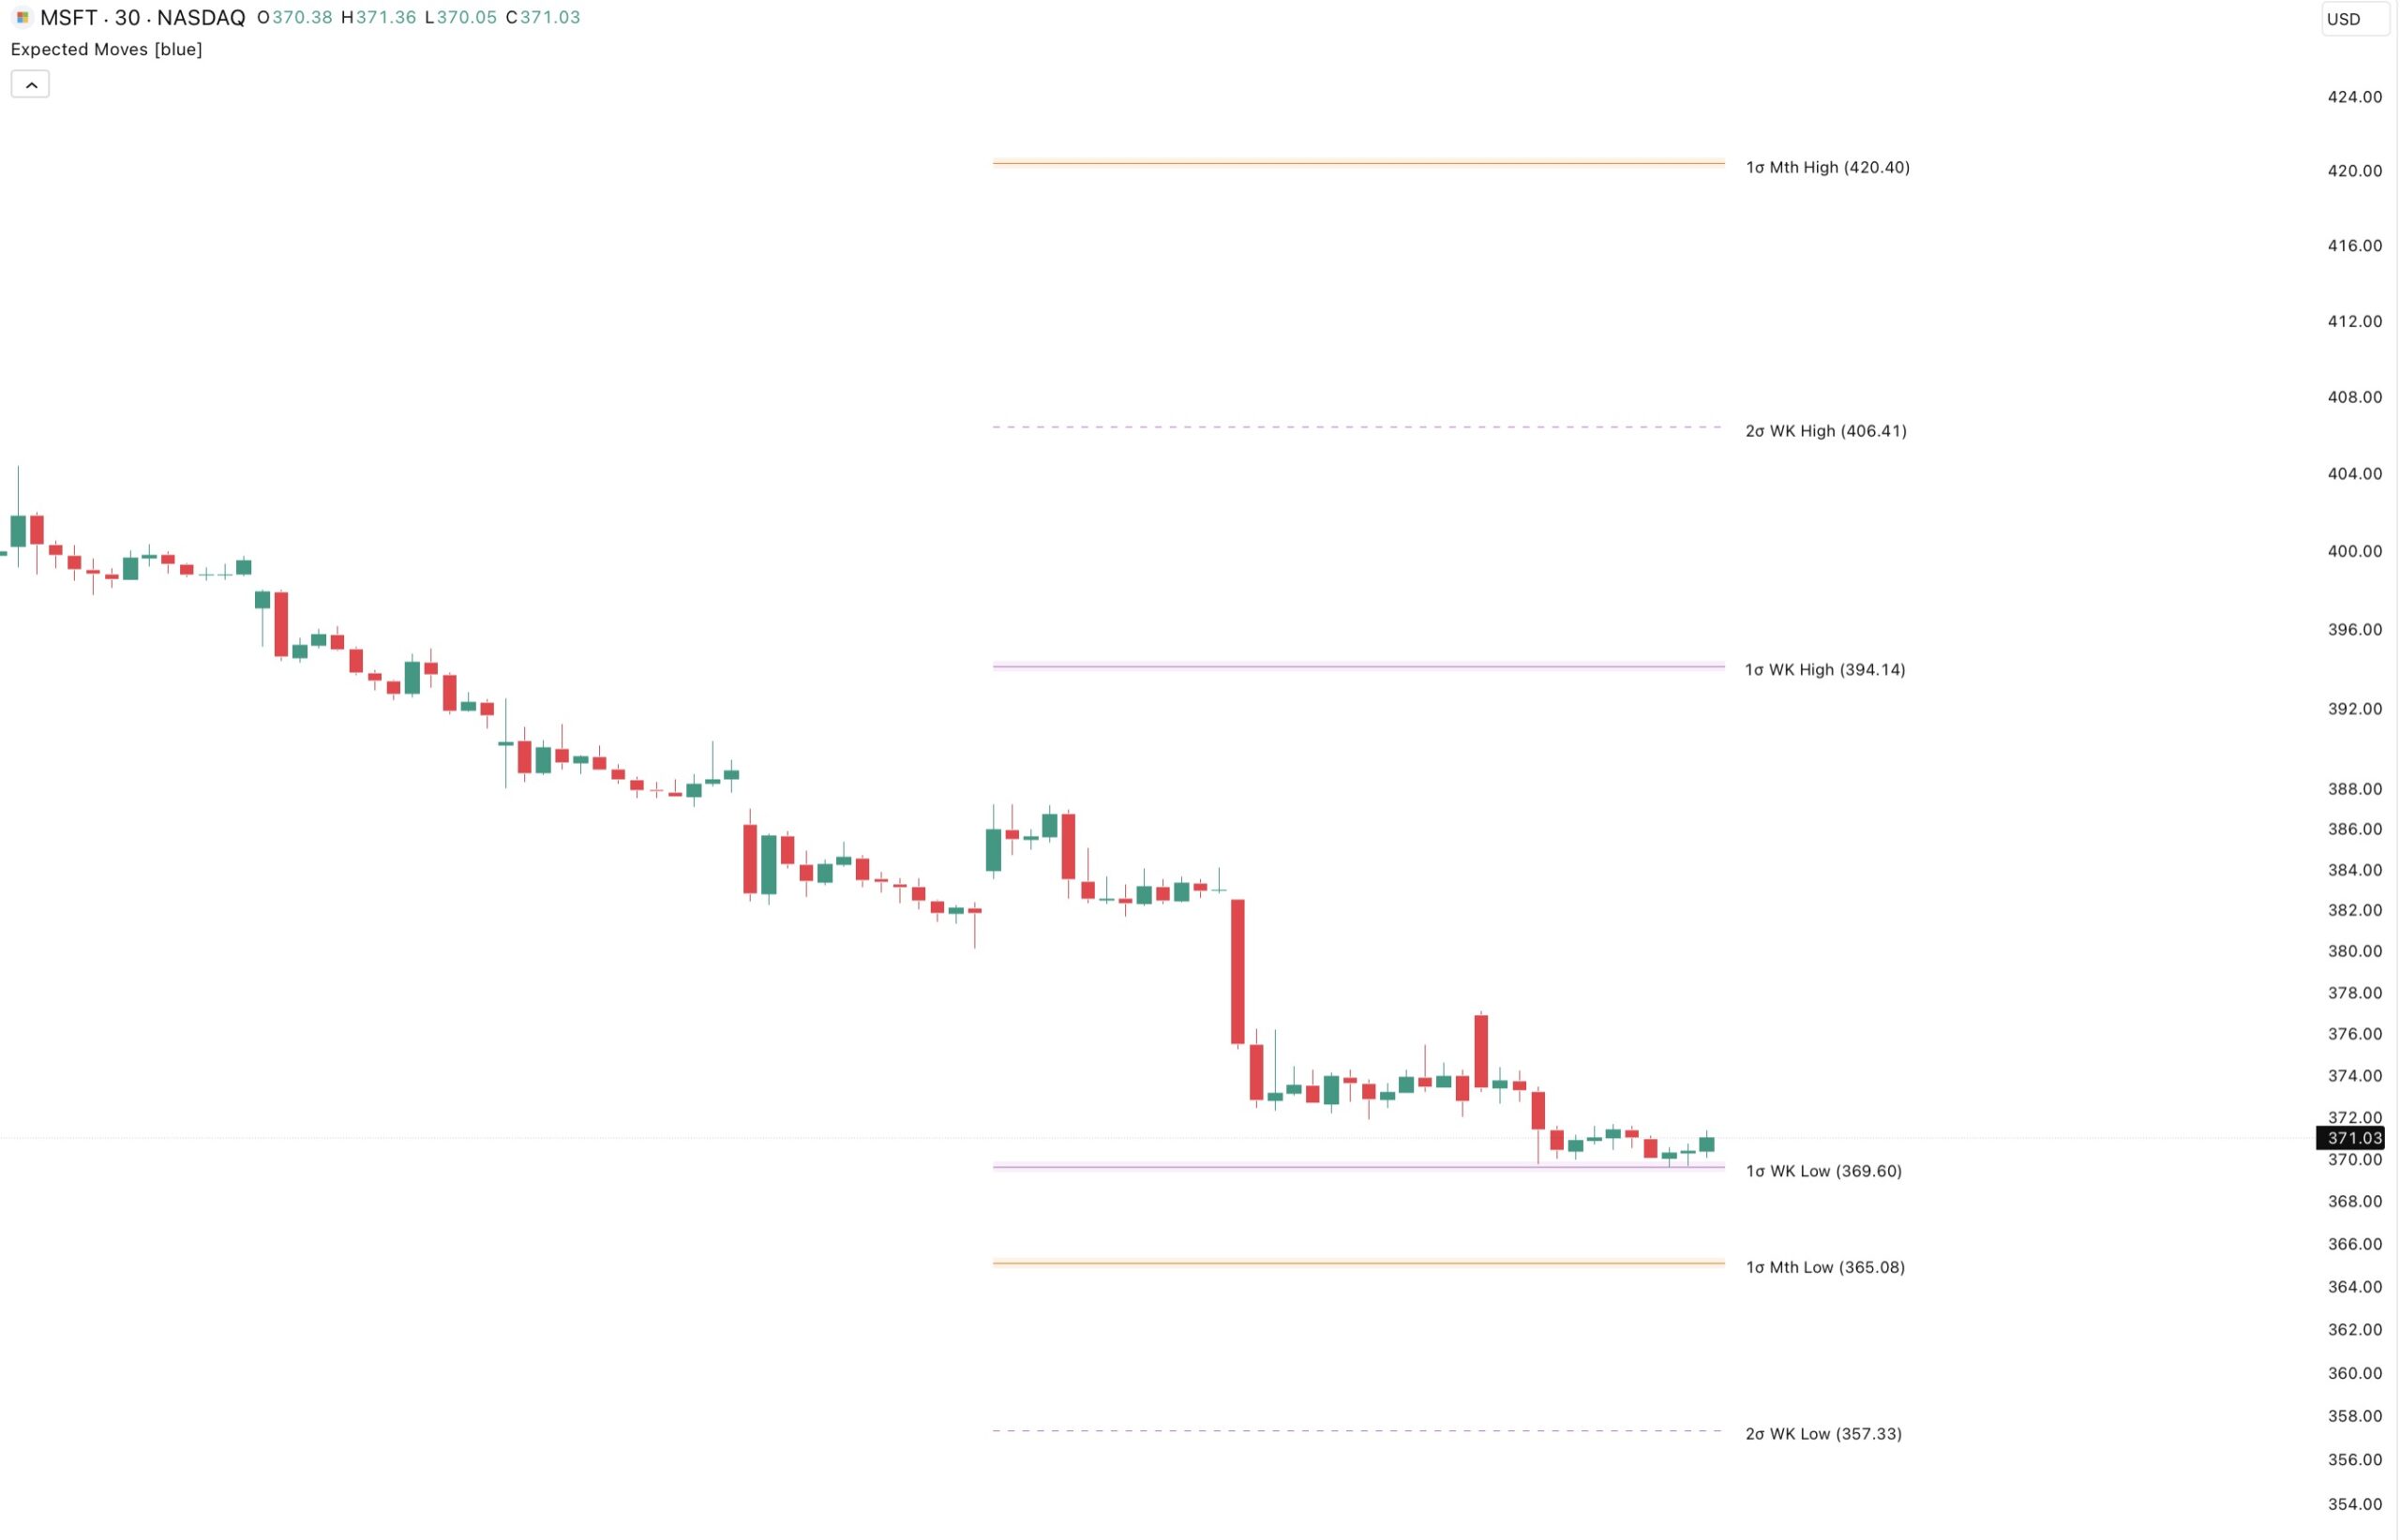
Expected Moves
Expected Move (EM) levels represent the statistically probable price range for a given timeframe, derived from options implied volatility. These levels help traders:
– Identify high-probability support and resistance zones
– Set realistic profit targets and stop losses
– Gauge whether price action is “normal” or extended
– Plan entries around key levels

Extreme Reversals
Based on RSI, CCI/Momentum, and divergences conditions, this indicator places a non-repainting buy and sell signal showing possible entries on a given asset. Users can adjust the conditions for RSI and CCI/Momentum to best fit their trading strategy.

Linear Regression Curve
Linear Regression Curve is a useful measure for technical and quantitative analysis in financial markets that help identifying trends and trend direction. The use of standard deviations gives traders ideas as to when prices are becoming overbought or oversold relative to the long term trend.