Last week began with a strong trend higher — perhaps even some frantic buying — that left behind a poor high. A poor high typically signals unfinished business to the upside, though at times it can also mark short-term exhaustion. What it is not is a durable high; for that, we’d want to see meaningful RTH excess. On Tuesday, sellers stepped in, breaking Monday’s trend and leaving that poor high even weaker. I’ll let it slide for now, but I do expect it to be cleaned up.
Selling continued into midday Thursday. For now, I don’t see this as higher-timeframe selling, though that would be proven wrong if sellers establish a lower high and push through the prior two-week lows. My view is that much of Thursday’s pressure came from pension fund quarter-end rebalancing and profit-taking rather than aggressive short selling. The low made that day was solid and well-placed — though I would have preferred it to take out the FOMC low. Since it didn’t, that level remains vulnerable as a magnet if sellers gain traction.
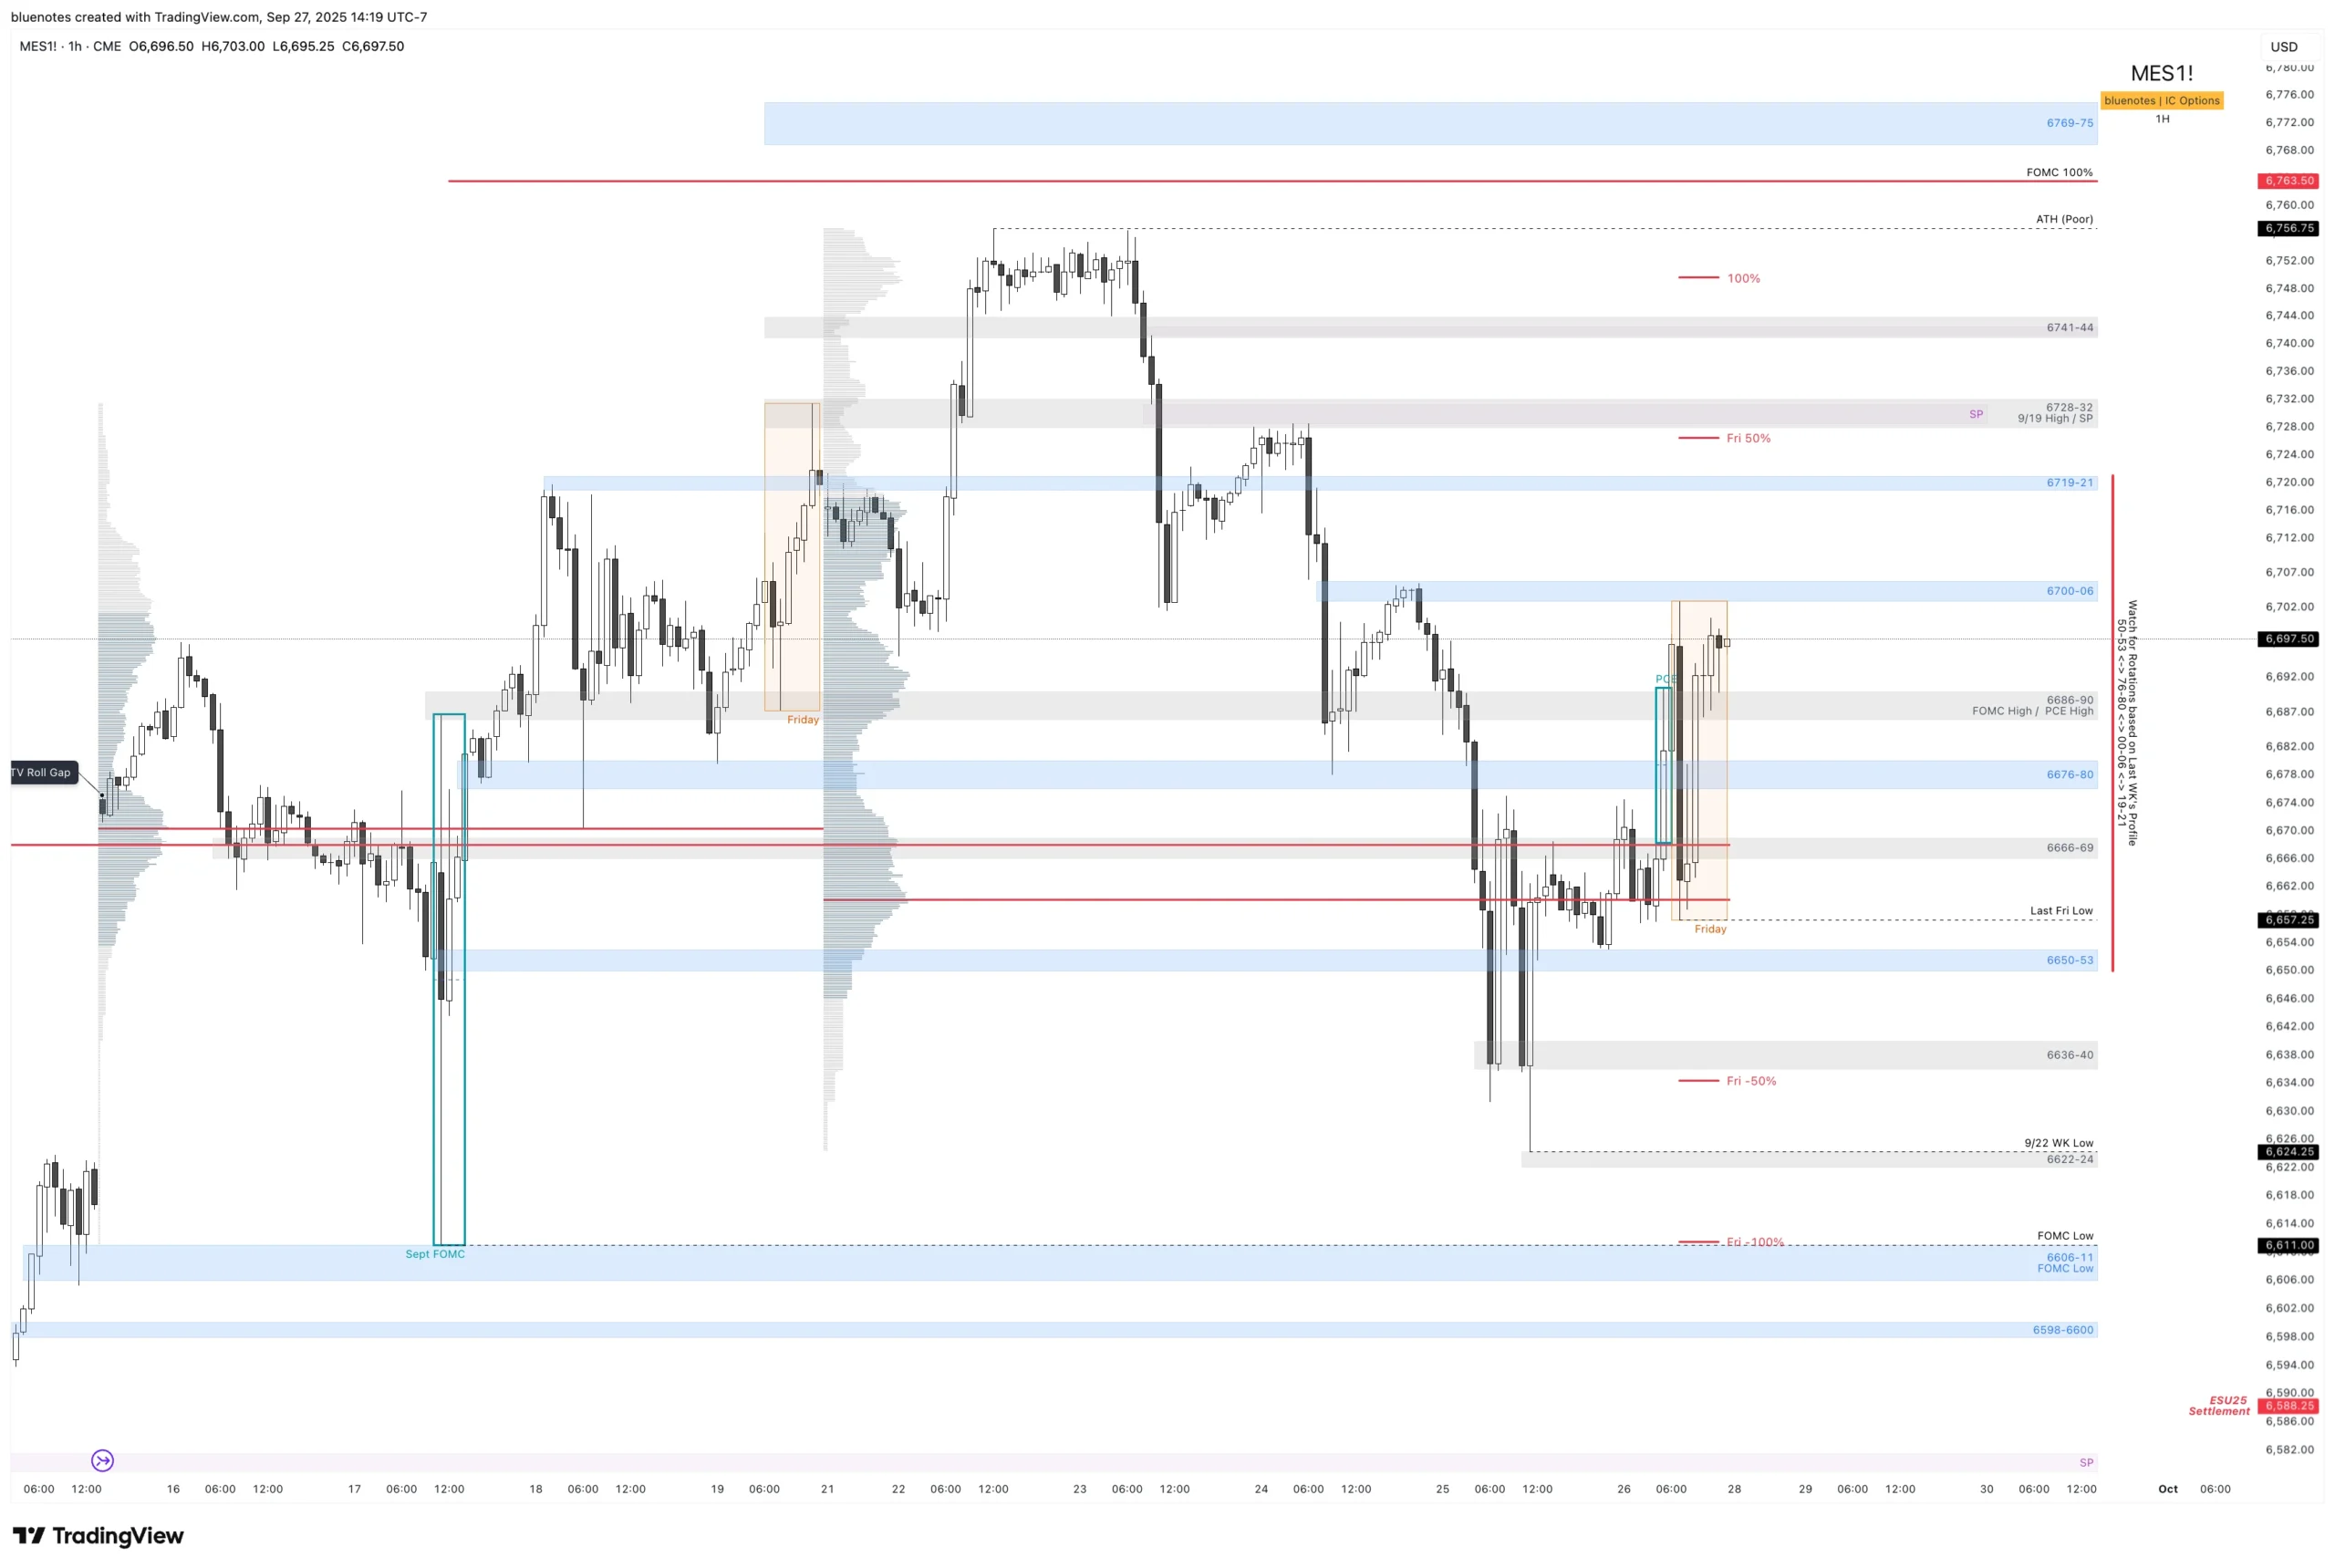
Friday held Thursday’s recovery and found support on PCE data. Price action also cleaned up most of the single print from Wednesday’s session. Remember: RTH structure needs to be repaired in RTH. Because Asia had traded through most of it but RTH hadn’t, the single print remained a magnet — and Friday delivered, with rejection right at 6703, a major target following Thursday’s structural shift.
Looking at last week’s profile, you can see clear rotation zones. This week, 6700–6706 will be a key pivot: can buyers move above and sustain, or not? Otherwise, expect continued rotations across the weekly zones at 6650–53, 6676–80, 6700–06, and 6719–21. Note that 6686–90, sitting between 6676–80 and 6700–06, is also a key reference: 9/19 Friday’s low, the FOMC high, and last Wednesday’s base.
For this week, I’ll be using Friday’s range (6657.25–6703) as the primary guide. Friday’s high lines up with remaining bearish single prints from Wednesday and a major weekly LVN. Friday’s low is anchored by last week’s POC and just below with the 6650–53 zone also near last week’s VAL.
Trading Higher:
- Sustaining above 6700–6706 (watch for a LAAF setup) opens 6719–21, followed by 6728–32 where another set of bearish single prints sits.
- As long as 30-minute structure holds, I’ll favor higher lows. A break in structure could signal either a lower high and trend shift or simply a new inside-week balance.
- Holding above 6719–21 supports the bulls’ objective of cleaning up the poor ATH and pushing to new highs. That’s where I’d be trimming heavily and keeping runners, since stops and profit-taking are likely clustered there. Any pullback afterward would need 6719–21 to act as support.
Trading Lower:
- If we fail to hold above 6700–6706, I’ll look for 6676–80 to act as support, with potential for a quick LBAF.
- A sustained break below 6676 risks Friday’s low and the 6650–53 weekly zone — not a great look for buyers. Below 6650, lower highs and lower lows would confirm a continued short-term downtrend.
- A break of the FOMC low with continuation would further mark a meaningful character shift, reinforcing the seasonal weakness narrative. Notably, Friday’s 100% extension lands right at the FOMC low, making it a strong magnet.
- As before, I’ll be looking for longs around 6606–11 if tested, with 6650–53 needing to be reclaimed on any reversal.
Final Thoughts:
The daily chart is in balance, but the weekly and monthly remain OTFU. The gamma flip line (SPX 6597 as of Friday) sits just below; trade under that level would likely bring higher volatility. We now have two major magnets — the ATH above and the FOMC low below — with clear paths to either if the market commits.
For those using fibs: the 0.618 retracement aligns neatly with 6700–06, while the 0.786 aligns with 6728–32. Both could serve as lower-high locations if sellers follow through. My personal lean is for a test of one of those areas, followed by a move back toward the FOMC low — but that depends on sellers actually showing sustained aggression. If they do, pattern traders will be salivating their potential H&S setup. Holding above 6700 and then 6719 we aim to clean up ATH.
That’s it for now. We’ll see where Monday opens. Two magnets in play, both with a clear path. Until then — level by level with bias in check.
ES Live Chart: https://www.tradingview.com/chart/f8EEzTyy/
Minor Levels:
6842-6845
6823-6826
6798-6801
6741-6744 SP
6728-6732 9/19 High / SP
6686-6690 FOMC High / PCE High
6666-6669
6636-6640
6622-6624 Last WK Low
Major Levels:
6863-6866
6769-6775
6719-6721
6700-6706 SP / Fri High / Early Pivot ↑↓
6676-6680
6650-6653
6606-6611 FOMC Low / Fri Extn 100%
6598-6600 9/11 Spike Top
6558-6562 CPI High