There remains a notable divergence between ES and NQ. Meanwhile, RTY and YM have been more constructive and now look quite strong. If we’re to see any meaningful downside, it will almost certainly require all four indices moving together. So far, money has stayed invested in the market and simply rotated between sectors—healthy behavior as long as it continues. True concern would come from correlated selling across all indices. At the moment, the weak link is NQ. If RTY and YM also give way, ES will follow.
NAAIM exposure sits near 100 (98.15). While not an exact timing tool, it reflects managers heavily committed to equities. Historically, NAAIM can sit at extremes for months before rolling over—but eventually, selling begins. They’re also usually late to any party.
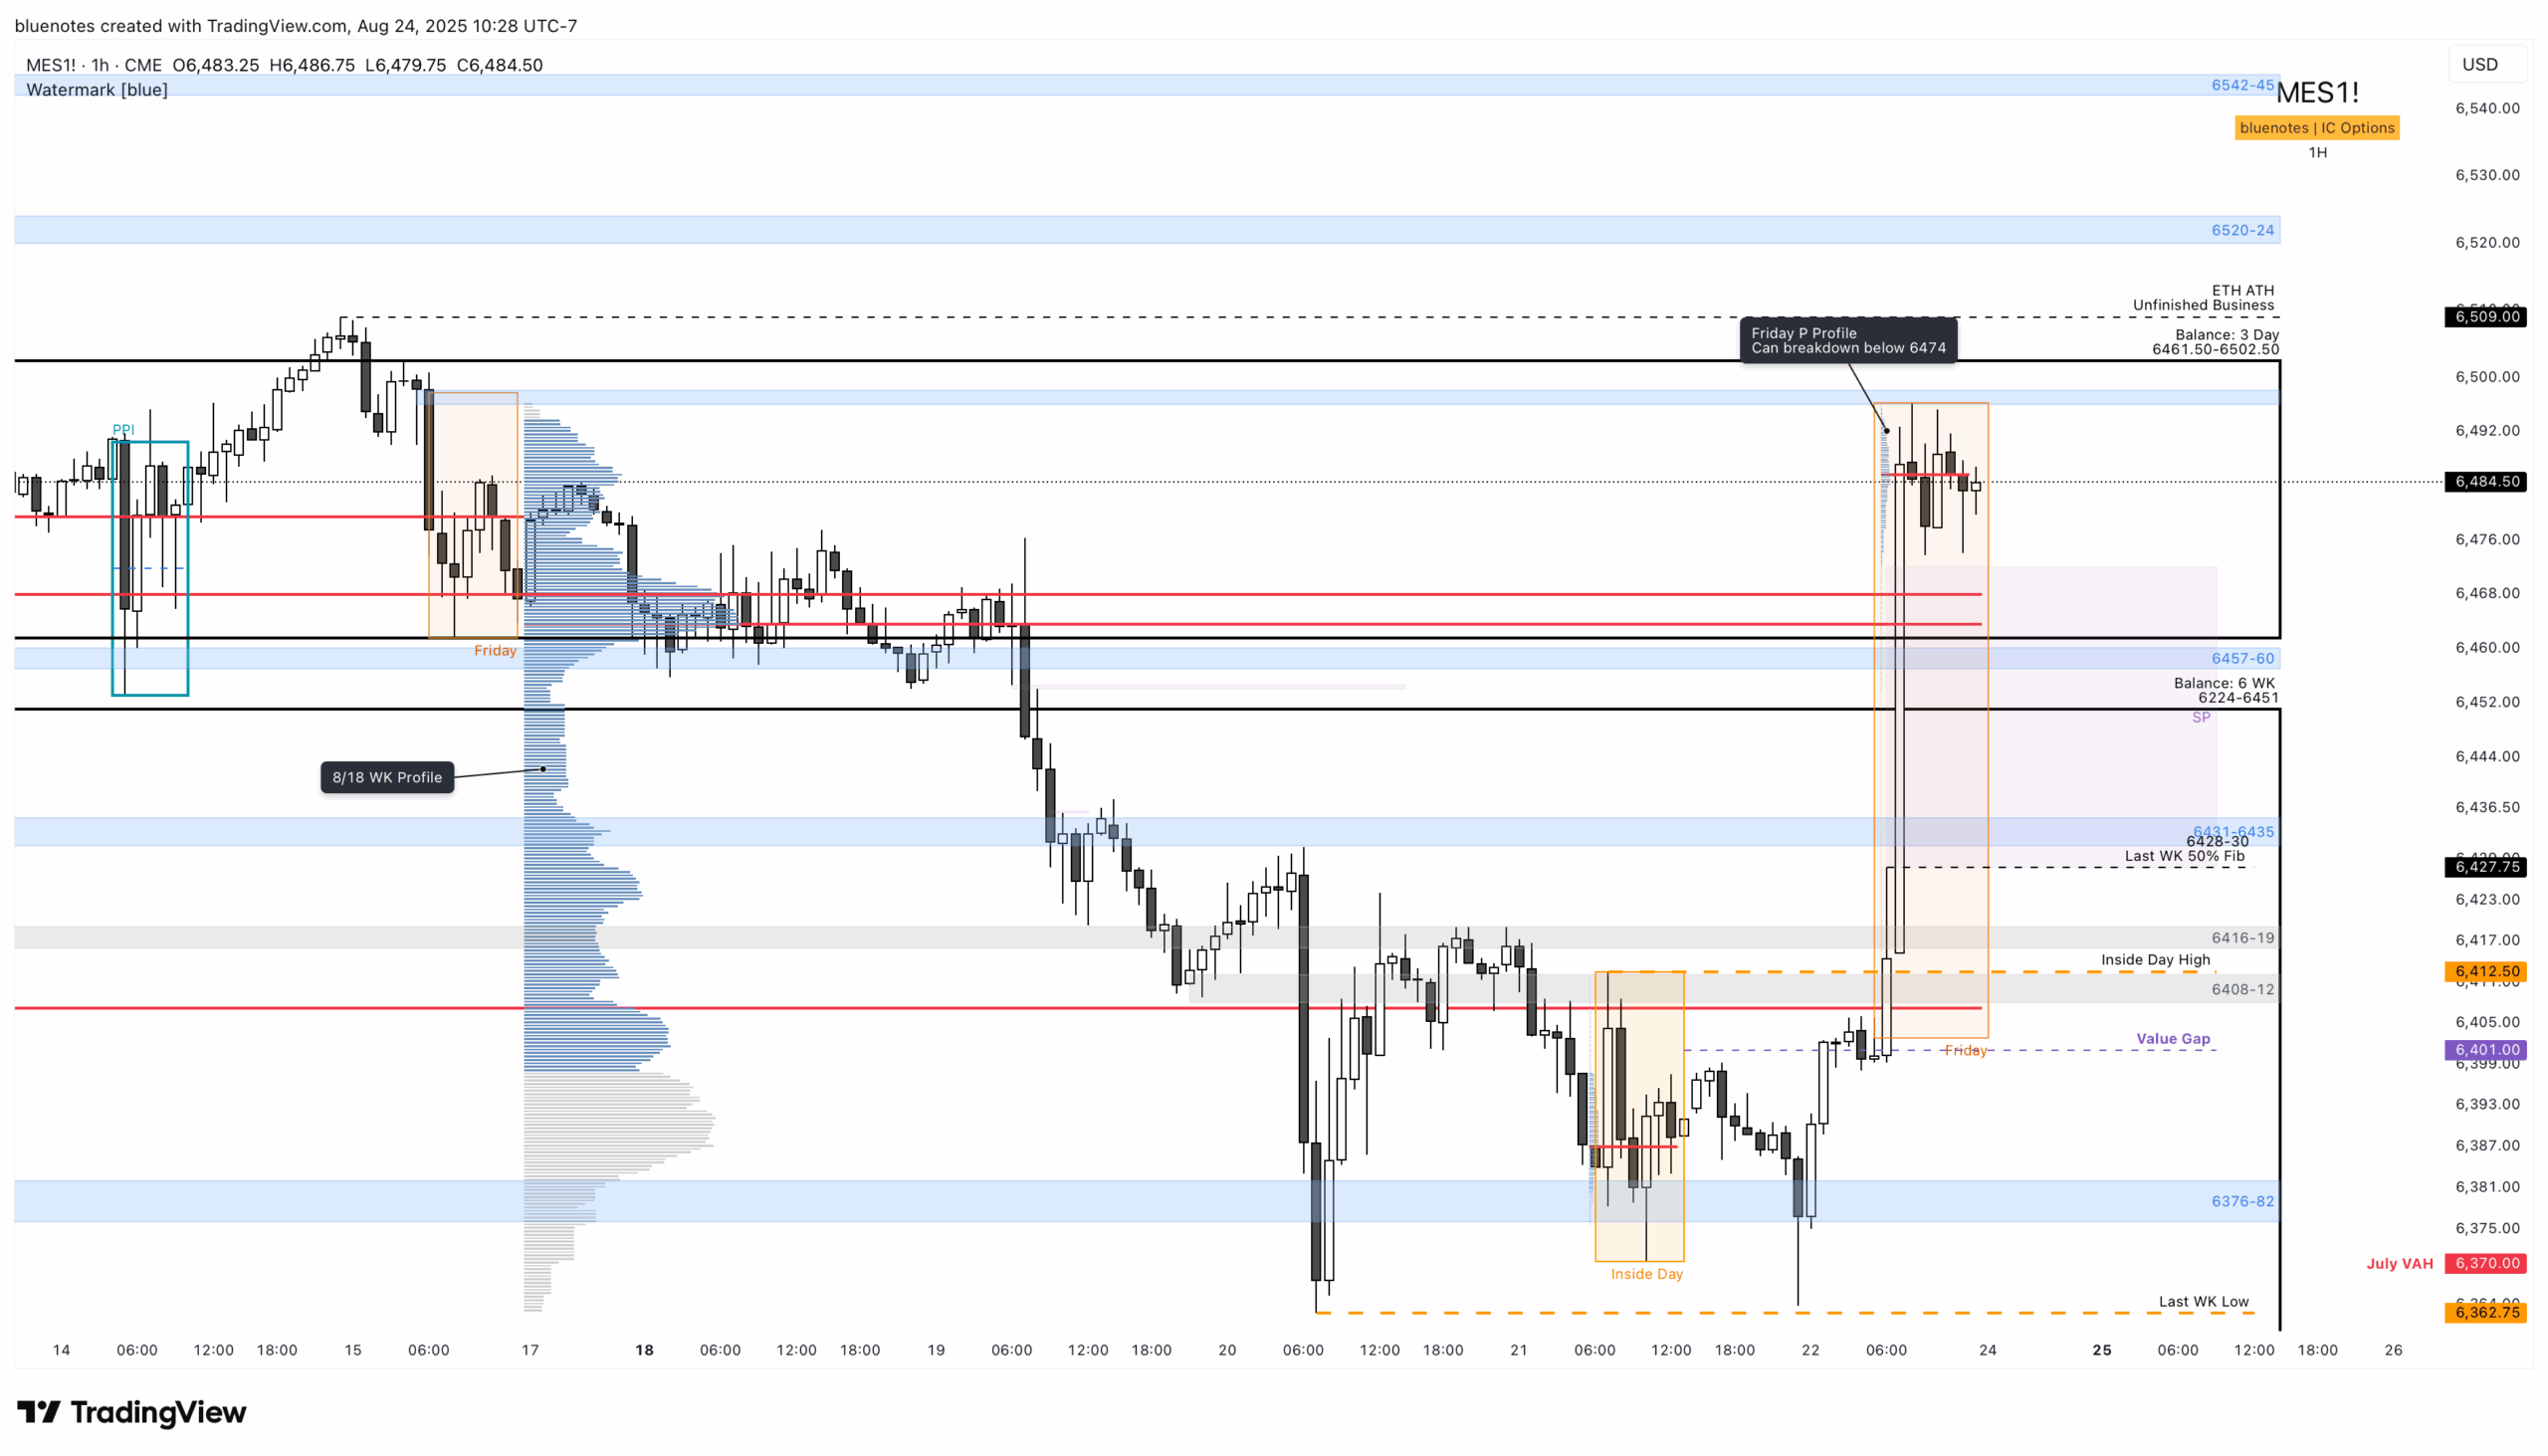
We closed the week back above 6460, a key level sellers needed to defend to maintain a lower high. Instead, they were overwhelmed Friday. ES now sits above the six-week balance, inside the prior three-day balance, and resting within the upper distribution of the last two weeks. That’s constructive for buyers, though Friday’s P-shape profile is a reminder to remain cautious on the long side.
A loss of 6474 could invite weakness, potentially backfilling toward the low 6400s. However, several key support zones lie below. As long as 6431–6435 holds—or even after a quick LBAF of Friday’s single prints (6427.75–6472)—buyers who missed Friday’s rally may step in. The 6431–6435 zone is especially important as it represents the ~50% retracement of last week’s rally. Below that, Fibonacci support appears between 6408–6412 and 6416–6419, aligning with Wednesday’s inside day high.
Trading Higher
- A break above Friday’s high opens the door to the 3-day balance top and the ETH ATH at 6509, unfinished business for RTH.
- Further acceptance above 6509 targets:
- 6520–6524 → 50% extension of the 3-day balance.
- 6564–6570 → 50% extension of the six-week balance.
Bearish scenario if higher:
A failed sweep of the ETH ATH (6509) that drops back below 6496, followed by acceptance under 6457–6460, would create a potential swing high. Ideally, this develops during RTH with clear excess.
Trading Lower
- Friday’s single prints (6427.75–6472) form a broad zone where buyers may appear. The first key test is 6457–6460, sitting between two balance areas and a key pivot last week. A LBAF here remains in play, similar to last week’s plan.
- The 6430–6460 zone is likely to be messy chop. Best setups may occur at the edges—particularly 6431–6435, which aligns with fibs mentioned above, single print closure, FOMC high, and August 10–11 highs.
Acceptance below 6431–6435 becomes problematic:
- Opens Friday’s low.
- Targets the value gap near 6401.
- Re-enters Thursday’s inside day range, putting 6376–6382 back into play—a level where strong bids appeared last week. Whether they return again remains to be seen.
ES Live Chart: https://www.tradingview.com/chart/f8EEzTyy/
Many times, I have mentioned that it is better for buyers to always probe lower first vs higher. If NQ’s weakness persist and YM and RTY decide to give up, this will increase pressure on ES. Taking out the ETH ATH and replacing it with a RTH high then failing the breakout would be quite unfortunate. Friday’s low is massively important for buyers to sustain. Engage at the edges and be patient. I will leave it at that for this week and see where we land on Monday.
This will be the last weekend plan until October as I will be on holiday in Europe.