
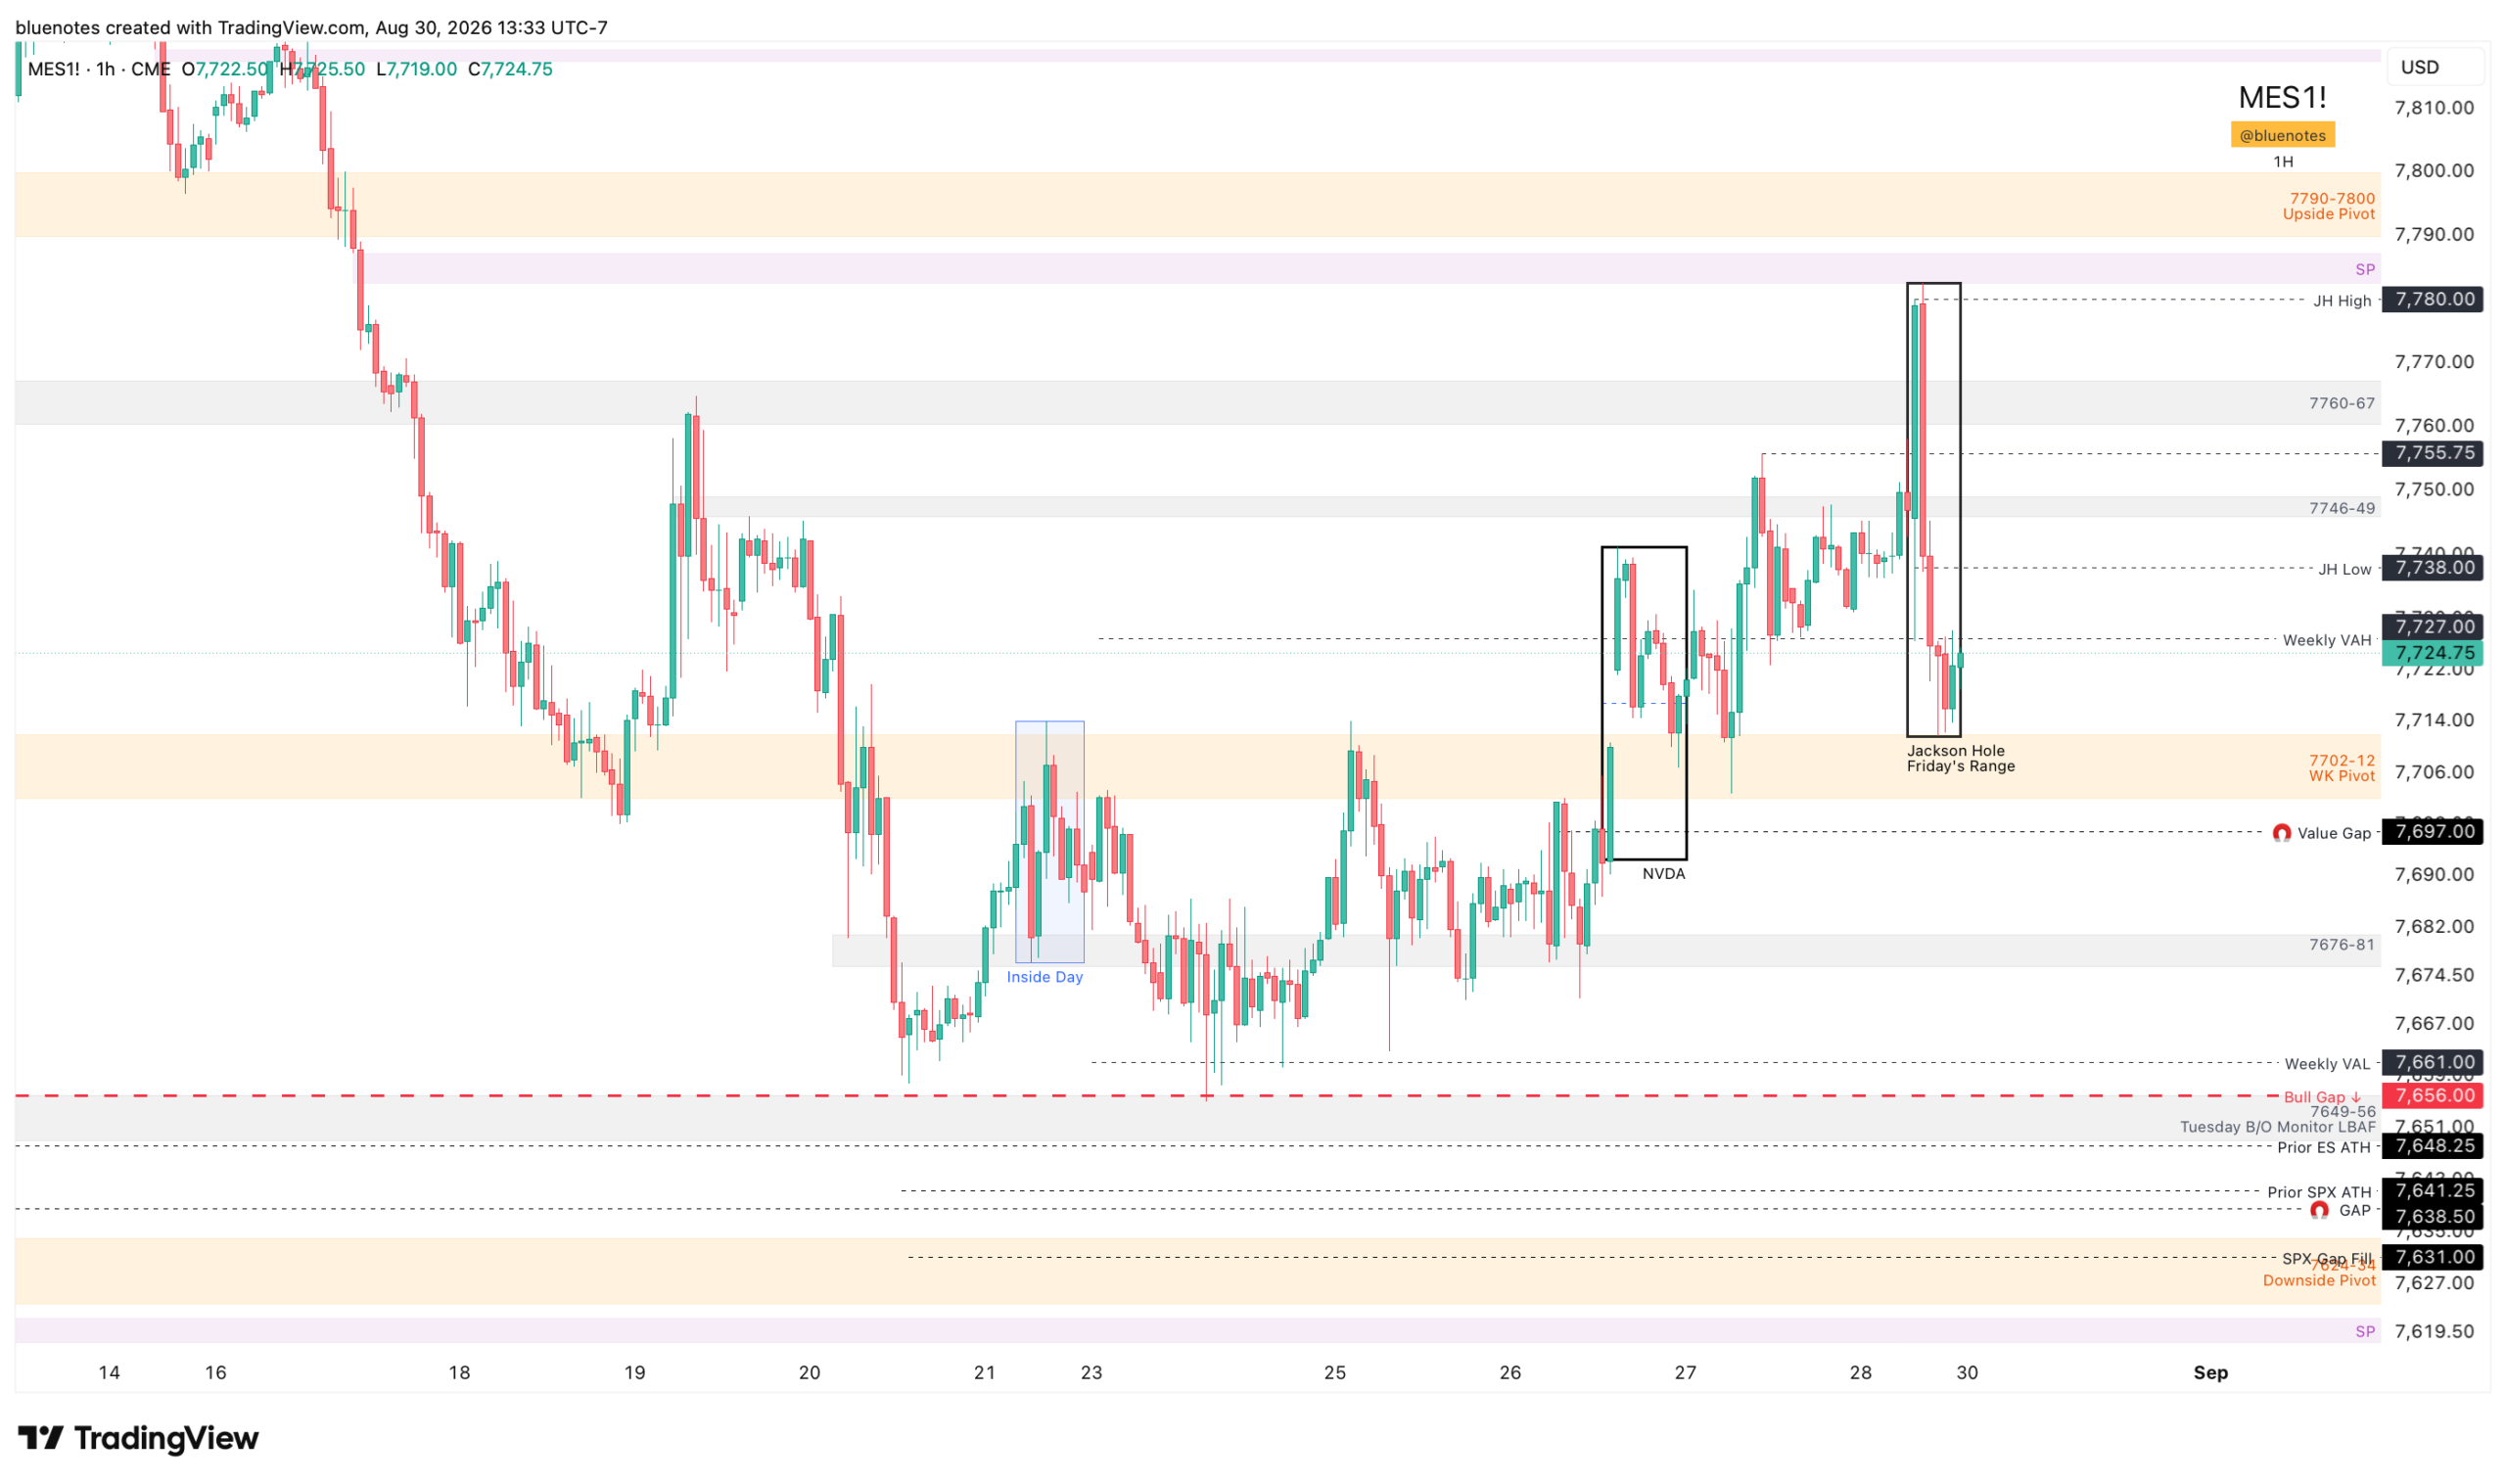
Weekly Pivot: 7702-7712
Upside Pivot: 7790-7800
Downside Pivot: 7624-7634
3WK Balance: 7655-7838
ES enters the week with a modest bullish advantage, but buyers have little room for complacency. Last week’s recovery preserved a constructive weekly structure, while Friday’s sharp rejection showed that overhead supply remains active. The dividing line is 7702-7712: holding this area keeps the upside in play; sustained weakness below it shifts the advantage to sellers.
Last week, ES successfully tested its bullish regular-session gap and reclaimed a key pivot before advancing. Despite Friday’s pullback, the market finished just above the low-volume area separating the week’s two main trading distributions. That leaves the bullish structure intact, though it still needs follow-through.
The concern is participation. Several individual stocks and sectors posted weak weekly candles, tempering confidence in a broad, durable advance. With relatively light volume and low volatility expected into Labor Day, failed breakouts and sharp reversals remain risks. Buyers need to prove they can hold higher prices.
Trading Higher
Buyers defending 7702-7012 or a brief LBAF followed by a quick reclaim, keeps 7746-7749 in focus as the first upside target. If Friday’s selling produces no downside follow-through, trapped sellers could help fuel the recovery.
Above 7746-7749, watch 7760-67 on the first test. Additional supply extends toward Friday’s high and 7780-7787 (remaining SP 82.5-87.25). Favor selective entries and measured expectations as price approaches these areas.
A brief breakout above last week’s high that quickly reverses would warrant caution. For a rejection above 7746-7749 to develop into a bearish setup, sellers need to push price back below that range and hold it as resistance. That would reopen a potential move toward 7702-7012. Conversely, sustained acceptance above 7783-7787 would favor a move back toward the current all-time high.
Trading Lower
Sellers gain control below 7702-7012. A quick dip is manageable for bulls; persistent lower highs and lower lows are not. Without a prompt reclaim, downside targets become 7697 (value gap), 7676-7681, and then last week’s low.
Below last week’s low, watch the prior all-time high at 7649, followed by 7635-7638, the regular-session gap-fill area. Further potential reaction zones are 7613-7631 and 7588-7595. These could produce sharp reversals, but touching support alone does not confirm a successful backtest. A recovery must reclaim last week’s low to begin rebuilding the bullish sequence.
Last two weeks sellers have failed to accelerate below Weekly VAL, trapping late sellers. This week I’m keen to watch how Weekly VAH responds to give us an insight into buyers intent. The case for observing buyer intent becomes interesting as yet another sharp event led rally found a reversal – something we saw post PPI as well.
For swing longs after a deeper decline, patience matters. ES still has room to establish a higher low on the weekly chart, but a fresh multi-day trading range followed by an upside breakout, particularly a recovery above 7649-7656, would provide stronger confirmation.
This week’s edge comes from how ES behaves around its levels, not from committing early to a direction. Above 7702-7012, buyers retain the opportunity to work through overhead supply. Below it, failed reclaims favor further downside. Let price establish control, take failed breakouts seriously, and require confirmation before treating a bounce as a lasting turn.
ES Expected Move this week: 91pts
Grab the expected move indicator and add the updated dataset to display the levels that are shown for all the products on the table into your TradingView chart for the coming week.