Last week delivered an important shift in market character. The issue was not simply that ES declined from an all-time high, it was the speed of the move and the near total absence of meaningful buyer defense. ES rejected 7792-7796 (last Friday’s low) early Monday, cut through the prior week’s primary distribution during the same cash session, and then gapped below the prior week’s low on Tuesday. That kind of price action demands caution: buyers must now prove that the former breakout area can hold before another sustained move higher becomes the favored outcome.
The Bigger Picture
Equities remained notably weak even as bonds briefly rallied and gold and crypto strengthened. The 10-year Treasury subsequently surrendered its entire move, but strength in gold and crypto persisted. That divergence suggests capital may be rotating rather than broadly embracing risk.
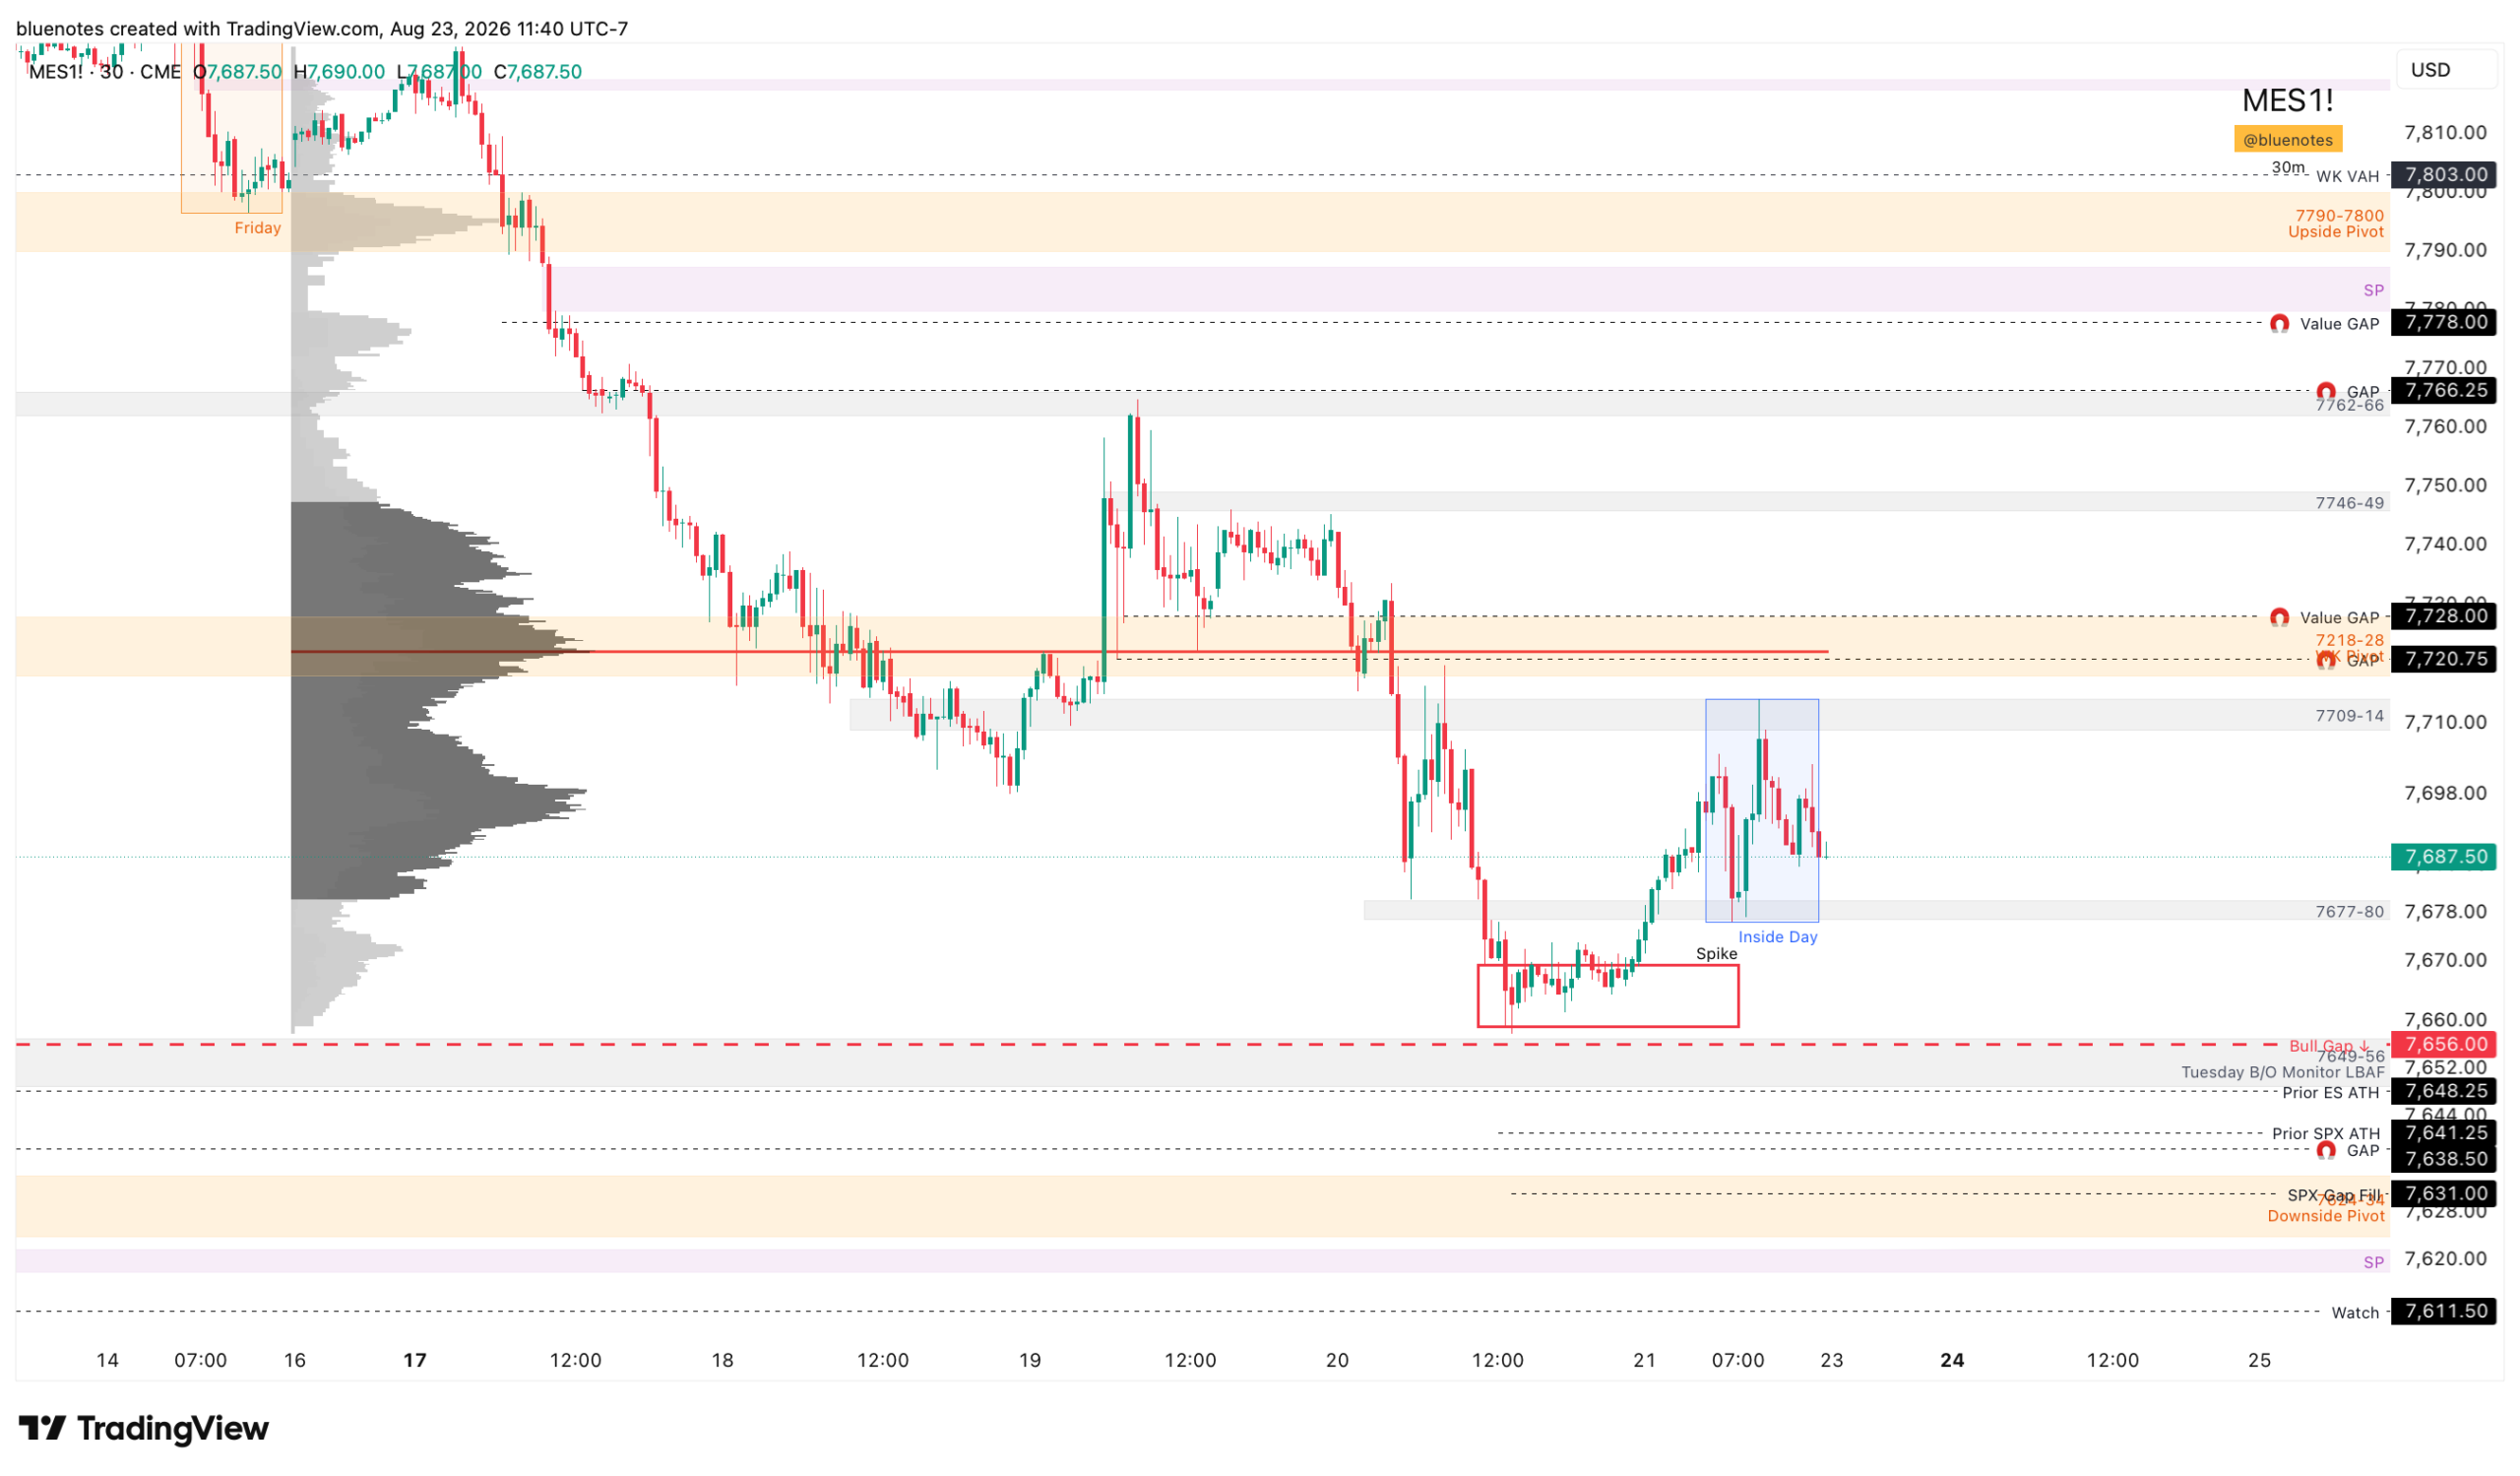
For ES, the central higher-timeframe question is whether the market can successfully back-test its prior all-time high. The RTH bullish gap spans 7638.50-7656, with the former ES all-time high near 7648. The prior SPX and SPY highs align more closely with 7635-7638, so the broader 7635-7656 region should be treated as the key breakout-test zone.
A brief move below the former high would not automatically invalidate the bullish structure. Sustained acceptance back inside the previous range, however, would raise the risk of a failed breakout and significantly weaken the case for an eventual move toward 7920.
A successful defense of the breakout area would keep 7920 in play; however, several important levels must first be reclaimed.
Weekly Pivot 7218-7228 and Friday’s high: 7709-7714
The first decision area for the week is 7709-7714 which includes Friday’s high. This zone acted as an important level throughout last week and remains a LVN on the weekly profile. Just above is the Weekly Pivot at 7218-28 which includes Thursday’s high. Between the two, this range spans 19pts. For now will focus on 7709-14 as the initial point of interest, otherwise 7218-28 is the main pivot to observe.
It may attract additional volume as the week develops, but it should initially provide a clear dividing line:
- Acceptance above 7709-7714 favors recovery.
- Persistent trade below it favors continued bearish development.
- A failed breakout above Friday’s 7714 high followed by a move back below this zone would be a particularly bearish signal.
- Friday is an inside day. Will need to observe if Thursday’s high, within the weekly pivot becomes a LAAF that that then falls back below Friday’s high.
Bullish Scenario
A reclaim and sustained hold above 7709-7714 would open the door to 7746-7749 (Weekly VAH).
The Weekly Pivot 7718-7728 area will serve as the main pivot of the week with 7709-14 as an early-week reference. The 7720.75 gap is still open on ES where as SPY and SPX did close it. Building a firm base above Thursday’s high would reduce the immediate risk of a failed breakout and improve the probability of continuation toward:
- 7746-7749 Weekly VAH
- 7762-7766 Gap Fill
- 7780-7787 Single Print
A look-above-and-fail (LBAF) at 7746-7749 could rotate price back toward 7718-28 and 7709-7714. By contrast, a firm base above 7762-7766 would meaningfully increase the odds that a durable low has formed.
The 7780-7787 area contains a large set of single prints from Monday’s decline and could initially cap a rebound. Sellers defending that area would still need to force price back below 7762-7766 and 7746-7749 before another test of 7709-7714 becomes likely.
Acceptance above 7780-7787 would strongly favor a return toward the highs. Even then, the top of the recent three-week balance should be respected until price breaks above it and demonstrates continuation.
Bearish Scenario
Persistent weakness below 7709-7714 would favor further downside, initially targeting the bullish gap and former breakout area.
The most important support region is 7649-7656. A brief break below last week’s 7659 low followed by a quick recovery could mark a major low, particularly because this zone aligns with the former ES all-time high.
For that reversal to gain credibility, buyers would need to reclaim:
- 7677-7680 as the minimum response
- 7709-7714 as the more important confirmation
The wider 7624-7656 area remains a reasonable location for a clean back-test because it incorporates the corresponding prior highs in ES, SPX, and SPY.
Sustained acceptance below that region would suggest the breakout has failed. In that case, 7618-7625 becomes the next potential trap and reversal area, although buyers emerging below 7649-7656 would still need to prove themselves through meaningful upside reclaims.
Below 7618, the better approach is to avoid anticipating support and instead monitor price until a new balance develops. A failed breakout could ultimately unwind toward the low from the week of August 2nd (Gap 7541).
Final Thoughts
This week is less about predicting the next major move and more about determining whether the prior breakout remains intact. The 7624-7656 region is the higher timeframe line in the sand, while 7709-7714 is the key near-term decision point.
If buyers defend the former highs and rebuild acceptance above 7709-7714, the decline can still become a constructive back-test that eventually supports a move toward 7920. If the market accepts below the breakout region, the character of the move changes materially and a deeper retracement becomes the more likely path.
Let price confirm the scenario. The strongest opportunities should come from failed moves at these defined levels, not from anticipating a turn before buyers or sellers have demonstrated control.
ES Expected Move this week: 103pts
Grab the expected move indicator and add the updated dataset to display the levels that are shown for all the products on the table into your TradingView chart for the coming week.