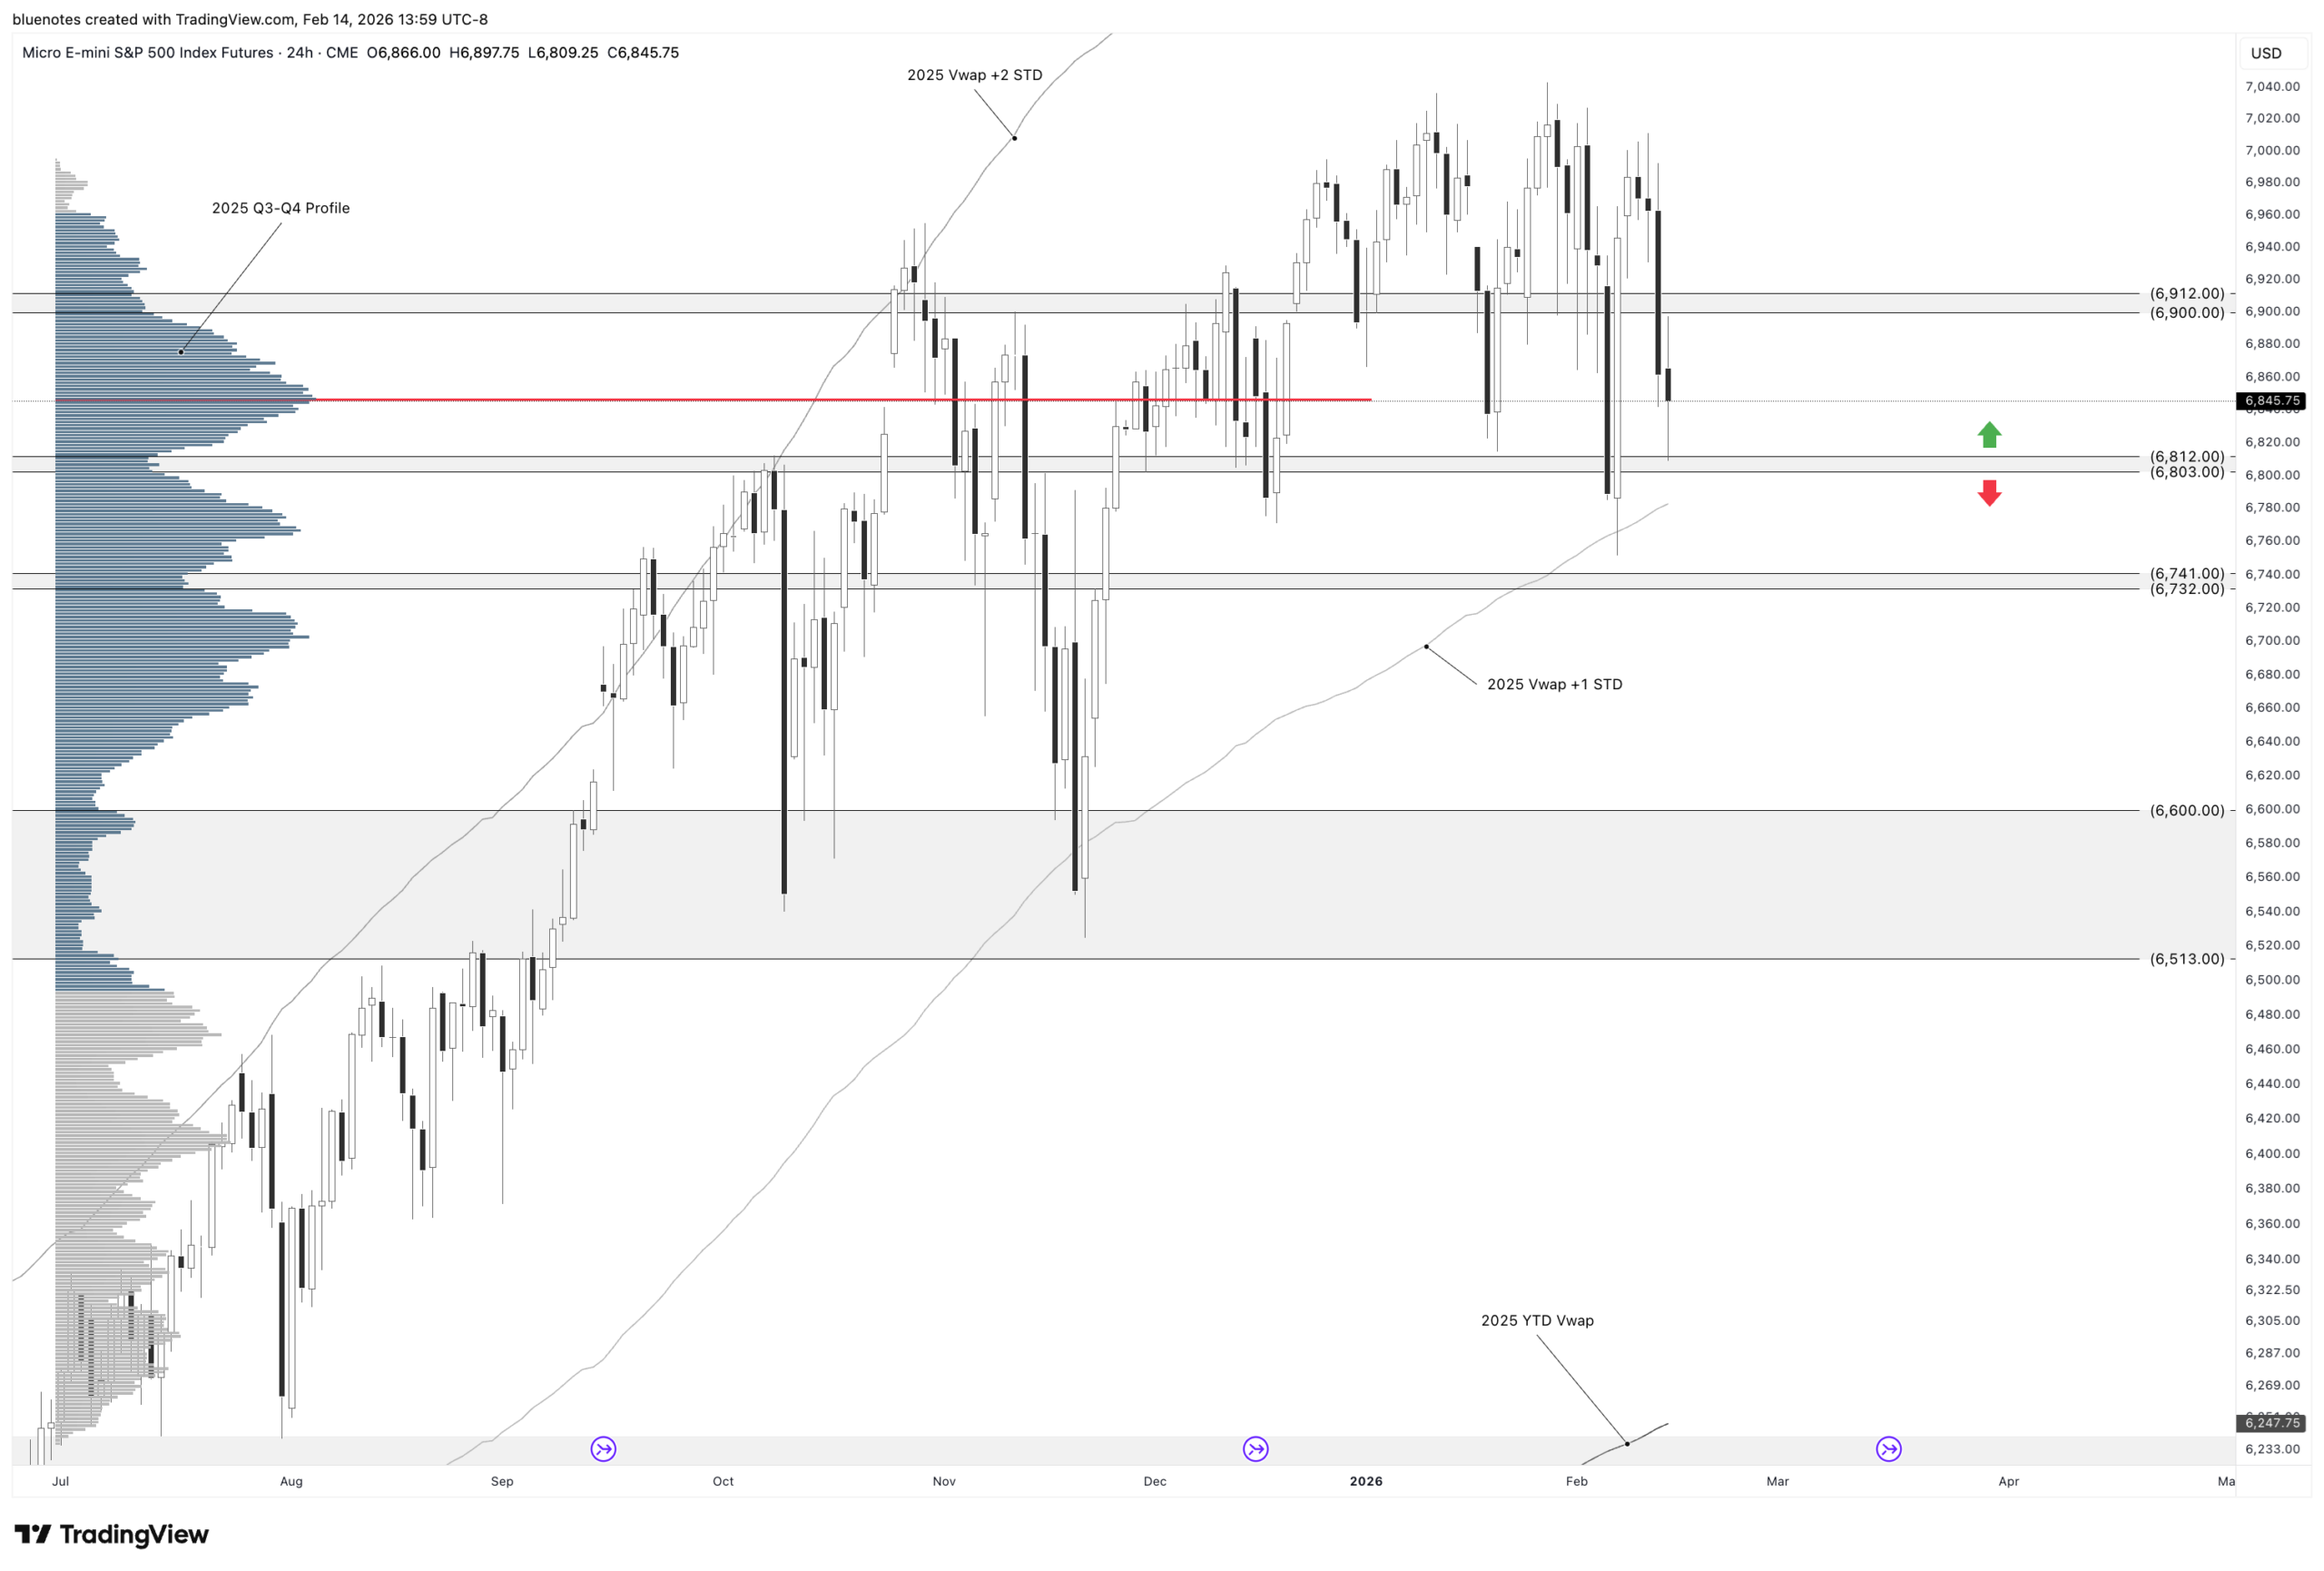
This upcoming week is all about the double distribution profile that developed on the S&P 500. I’ve mentioned repeatedly that sellers need to build volume below the 6900s, and we’re finally starting to see that occur.
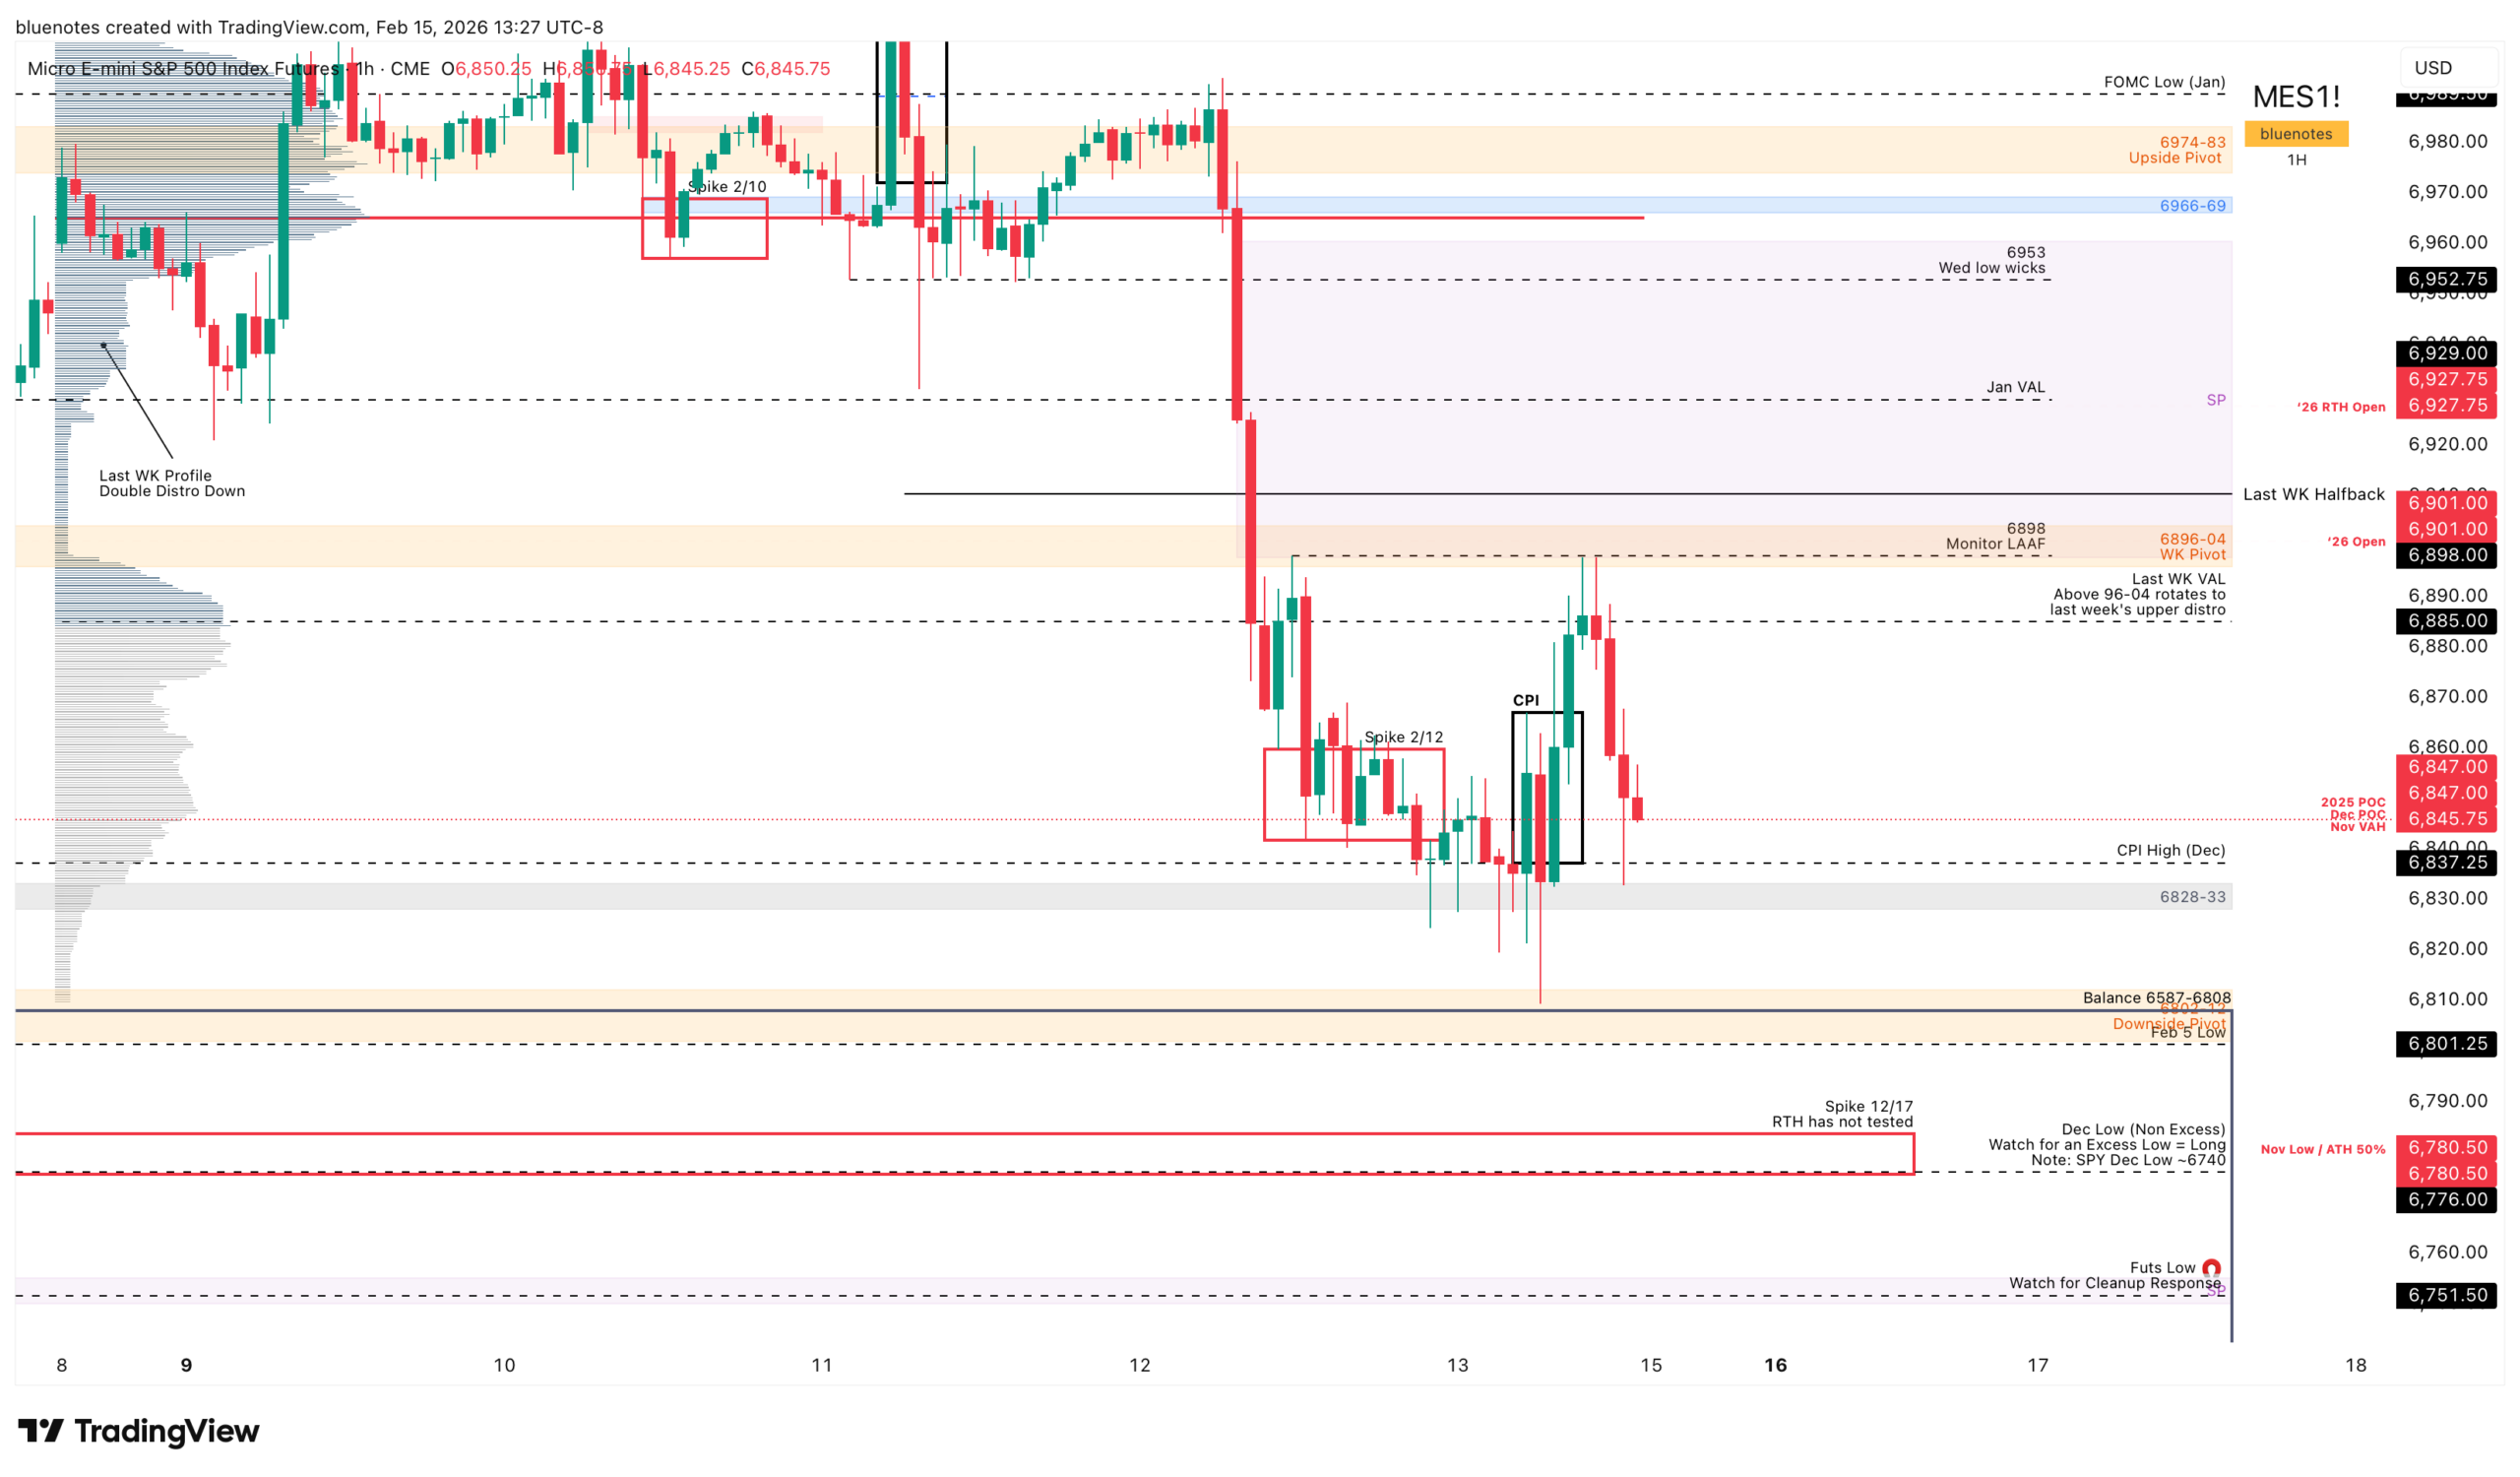
The February 3rd liquidation created a lower distribution range at 6886.25–6947.75, and buyers needed to reclaim it. They did, driven by the strong rally into February 5th but then lost it. This past week’s liquidation on Thursday then created a massive single print, with most of that structure forming right through the February 3rd lower distribution. The full two-period single print range spans 6897.75–6960.25.
Continued volume building in the lower distribution followed by a push through the lows of the past two weeks clearly favors sellers. That said, a reclaim of this past week’s upper distribution would trap a meaningful amount of Thursday/Friday selling. If there aren’t too many trapped longs looking to exit into that reclaim, buyers have a path to regain control.
💭This Week’s Playbook
🎯Weekly Pivot 6896-6904:
This zone aligns with Friday’s high, Thursday’s liquidation structure, and last week’s lower distribution. It’s the key inflection point for the week.
📈Trading Above:
Friday’s afternoon rally stalled at the 6896–6904 pivot, leaving equal highs and creating the potential for a LAAF swing short setup. However, a firm reclaim and acceptance above this zone can open rotation back toward last week’s upper distribution and a pass-through of the large single print.
With the profile above being thin, an area we moved through quickly on the way down, price could rotate quickly toward Thursday’s open and the 6966–6969 weekly level. I’d be mindful of 6953, which acted as key support during Wednesday’s cash session and remained important into the following Globex open. Also note that January’s VAL sits roughly mid-way through the single print, making it another possible reaction point.
Above 6966–6969, targets include 6989, 7006 (NFP high), and then 7022–7030. The weekly expected high comes in around 6992, which also aligns with the NFP halfback and Thursday’s pre-market highs.
📉Trading Lower:
Weakness becomes much clearer if ES remains trapped below 6896–6904, especially if volume and momentum continue building for a push toward the key yearly level around 6802–6812. Friday’s low was a strong low with clear excess, which is a checkmark for bulls. We also have relatively equal lows across the past two weeks. If sellers push lower and fail, producing a LBAF, then swing long attempts become reasonable. Any long attempt will ultimately need 6828–6832 reclaimed, with the initial target being a rotation back toward 6896–6904.
Further acceptance below 6802–6812 opens a test of 6751.5, where we need to monitor for a clean-up and strong buyer response. Below that brings 6724–6732 into play.
I’d keep eyes open in the 6741–6724 area, as it’s an important zone where a strong response is possible. The weekly expected low sits near 6708, which is a meaningful distance away for a four-day week, but still worth noting as a potential extreme.
ES Live Chart: https://www.tradingview.com/chart/f8EEzTyy/
Yearly Level 6802-12:
Any break of the 6802-12 HTF level opens November’s untested ETH low 6524.75. However, patience is needed for confirmation on the high time frame. Sellers clearly have the upper hand on the short term and we have unfinished business at last week’s ETH low 6751.5 and a test of the 6724-32 (Z cons low). Therefore, a confirmation on continued sell would be taking out 6751.50 and then having 6802-12 offered from below as a lower high. Any failed attempt by buyers to regain the balance (Range: 6587-6808) top opens full rotation down to 6587 later on.
Weekly Expected Levels:
I’ve made a new page available here for the upcoming week’s expected moves for ETF’s, common stocks, indices, and futures. You’ll know it’s the latest data by the week start date shown just above it.