ES remains locked in a conflicted market structure. Higher timeframes are still controlled by buyers, intermediate timeframes remain neutral inside a multi-week balance, and shorter timeframes have shifted in favor of sellers. That combination argues for continued two-way trade unless a true liquidation event develops. The priority this week is not prediction, but preparation: identify where sellers are likely to press, where buyers may respond, and where failed breaks can create actionable opportunities.
From a profile perspective, ES has rejected the volume built near the highs and has traded back into the broader range. That belongs in the bears’ column. Weekly value also gapped firmly lower relative to the prior week, confirming that sellers currently control the short-term auction. At the same time, ES has not taken out a prior month low, which keeps the higher timeframe bull structure intact for now. The June value area has fully engulfed May’s value area even though May’s low remains intact. That is not inherently bullish or bearish, but it does reflect elevated volatility, broad participation, and the kind of two-way trade we have been discussing for several weeks.
Market health remains a concern. Recent intraday swings have been violent despite a relatively muted VIX, suggesting poor order book liquidity. Friday’s close was another example of a market not functioning cleanly, with ES briefly disjointing from SPX in the final minute. I would not overanalyze that event beyond recognizing it as another cautionary sign.
My broader concern toward equities continues to increase, but that does not automatically translate into being bearish on price here and now. It is critical to separate longer-term risk concerns from the shorter-term read on the auction. Objectively, bulls still control higher timeframes, intermediate timeframes are neutral, and sellers currently control shorter timeframes. If shorter timeframes flip bullish, longs can still be favored. In fact, my current lean is that ES may find a tradeable low in the next few sessions, provided price action confirms it.
The risk of another larger correction remains elevated into the second half of the year, especially if market health does not improve. That said, the market is not yet structured for a major higher timeframe trend change. A fast liquidation event would likely still be treated as a buying opportunity unless the structure changes materially. The goal is to be prepared to react, not to predict.
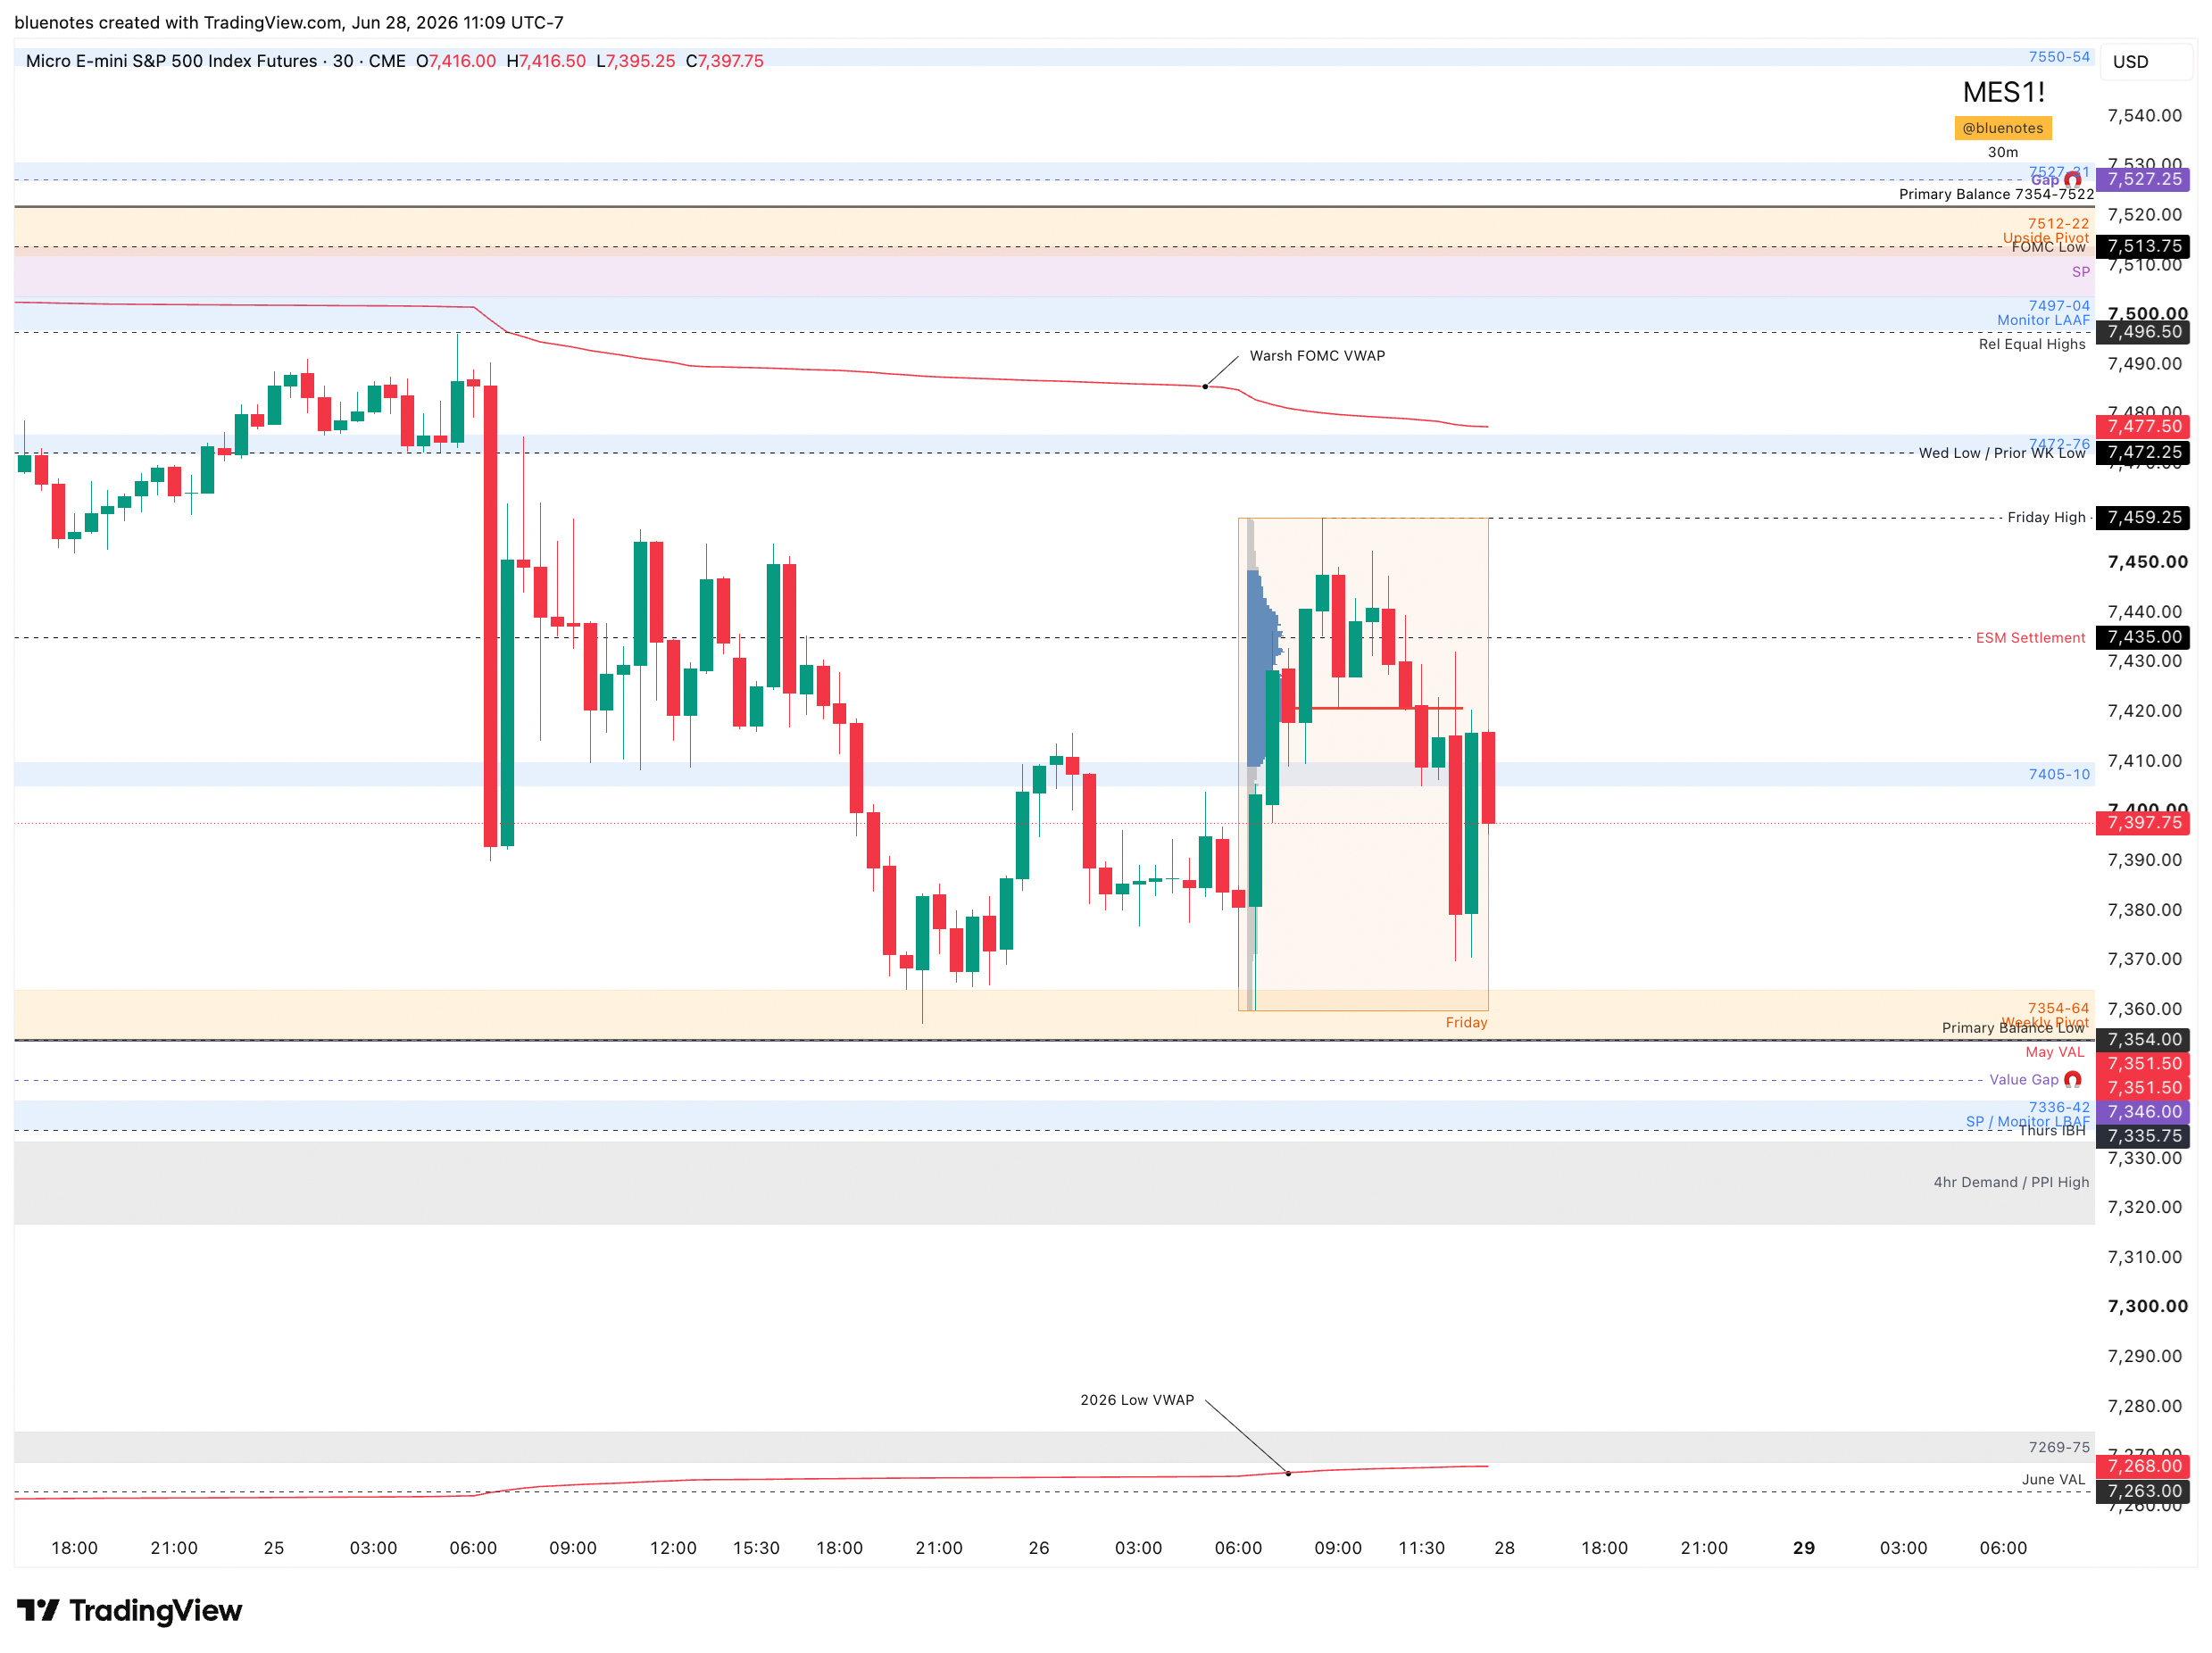
ES Key Structure
The primary rotational range for ES is roughly 7354-7364 to 7497-7504. Much of this week’s trade plan should be built around that range.
A failure above the relative equal highs near 7497-7504 would be a meaningful short setup, especially if ES trades higher first. A look above and fail at that area can target 7405-7410 as the first major downside objective, with continuation potential below if sellers remain in control. For that short to gain traction, ES would need to lose 7472-7476 and then Friday’s high area.
On the long side, the cleaner weekly idea is a failed break below last week’s low, with 7354-7364 acting as the minimum reclaim needed for the trade to become meaningful. That does not mean longs must wait for a perfect weekly setup. If ES trades lower first and produces a strong intraday failed break from a key level such as 7336-7342, that can be a valid early long attempt. A reclaim of 7354-7364, followed by 7405-7410, would then determine whether the trade has swing potential.
We also need to begin planning for the possibility of a failed break of the larger multi-week balance. The current balance low is 7247.25, but the downside structure can reasonably extend toward the May low at 7199. If ES reaches that area, the focus shifts from pressing shorts to watching for a failed break and potential higher timeframe long opportunity.
Trading Higher
A hold or failed break below 7354-7364 carries larger picture potential back toward 7497-7504. Friday held that lower range, but buyers could not follow through and the close was weak. If ES opens strong Sunday night into Monday, the upside scenario remains active, but expectations should be managed while sellers still control shorter timeframes.
A reclaim of 7405-7410 opens the door to 7420 followed by Friday’s high near 7459 and becomes the first real test of upside strength. A failure before or at that area would be suboptimal for bulls and could rotate price back towards 7405-7410.
The next major level is 7472-7476. A look above and fail there would be problematic on a weekly basis, especially with Thursday’s A period single prints sitting just above. However, sustained trade above 7472–7476 should test 7497-7504, which remains range high until proven otherwise.
A failed breakout at 7497-7504 can produce a rotation back toward 7405–7410. This setup is more attractive if ES trades higher first and fails, rather than after sellers have already failed lower. If ES instead holds above 7497-7504, that can trap sellers and generate a squeeze toward 7527-7531 where we need to watch for gap fill sellers. After any squeeze, the key question becomes whether fresh initiative buyers are willing to buy higher prices.
Trading Lower
Below 7405-7410, the bulk of last week’s buyers are at risk of being trapped. Buyers were active on dips below that zone last week, but if they stop defending it, ES likely retests and potentially takes out last week’s low.
The first key area below is 7336-7342. This level has been on watch for several weeks and is likely to remain important for the rest of the year. On a first test, a reaction is still likely, but the quality of that reaction matters. Because more volume has now built above the level, bulls are under more pressure than they were on the first approach. The closer ES gets to the recent balance low and the May low, the greater the risk of fresh buyers stepping in and shorts covering, which can create sharp countertrend rallies.
There are no major durable weekly levels between 7336-7342 and 7269-7275. Persistent weakness below 7336–7342, after an initial demand response, likely resolves toward 7269-7275. From there, ES would be close to taking out the multi-week balance low at 7247. The year-to-date low anchored VWAP is also sitting in the 7250s-60s and should remain on the chart.
At the balance low, ES also has an ETH low at 7232.50. If looking for a failed break of the broader balance, taking that ETH low would be preferable, though not strictly required. The 7197-7208 area is important from a higher timeframe perspective and currently protects the May low.
If May’s low at 7199.25 is taken out, a backtest higher becomes very common. The 7177-7186 weekly level, with an extension down toward roughly 7169, could be a strong response area and may trigger a failed break of the May low. Given the shortened holiday week and the size of the expected weekly move, that area is not a place to press shorts aggressively. It is an area to keep shorts on a tight leash and potentially begin looking for long setups.
Closing Thoughts
The base case is continued two-way trade inside a mature multi-week balance. Sellers currently control the short-term auction, but higher timeframe buyers have not lost control. That makes this a market where both sides can produce strong moves, but neither side has yet resolved the larger structure.
The preferred path would be a controlled move lower first, followed by a tradeable low and continued development of the multi-week range. A violent liquidation event remains a lower-probability scenario, but the risk is higher than usual given the recent deterioration in market health. If that type of event occurs, levels may not be respected as cleanly, and the focus should shift to risk control and identifying where forced liquidation exhausts.
Until proven otherwise, ES is still a rotational market. Do not chase weakness into major demand without confirmation, and do not assume upside continuation until buyers reclaim key levels and show acceptance. This is a week to stay flexible, define risk tightly, and let the auction confirm the trade.
ES Expected Move this week: 125pts
Grab the expected move indicator and add the updated dataset to display the levels that are shown for all the products on the table into your TradingView chart for the coming week.