We have contract roll this week, with ES and NQ moving from the March contracts into June. TradingView will switch the front contracts Monday night ahead of Tuesday’s session. Generally speaking, the levels themselves should continue to work reasonably well on the new contract, but of course their meaning changes a bit once roll occurs. ES should trade roughly 50 handles higher after the roll. I do not back-adjust charts, so Monday night’s Globex open will show a large gap on my charts. For the next few weeks, it will also be a good idea to keep SPY and SPX nearby for reference, especially with respect to major swing points and larger structure. Knowing where things like the November low and major gaps sit on SPY/SPX may matter more than usual during this transition.
For the levels below, I’ve included both ranges, with the ESM26 variants in parentheses. I’ll also include the adjusted ESM26 levels at the end so they can be plugged directly into the Multi-Range Highlighter indicator.
I personally will trade the June contracts starting on Sunday.
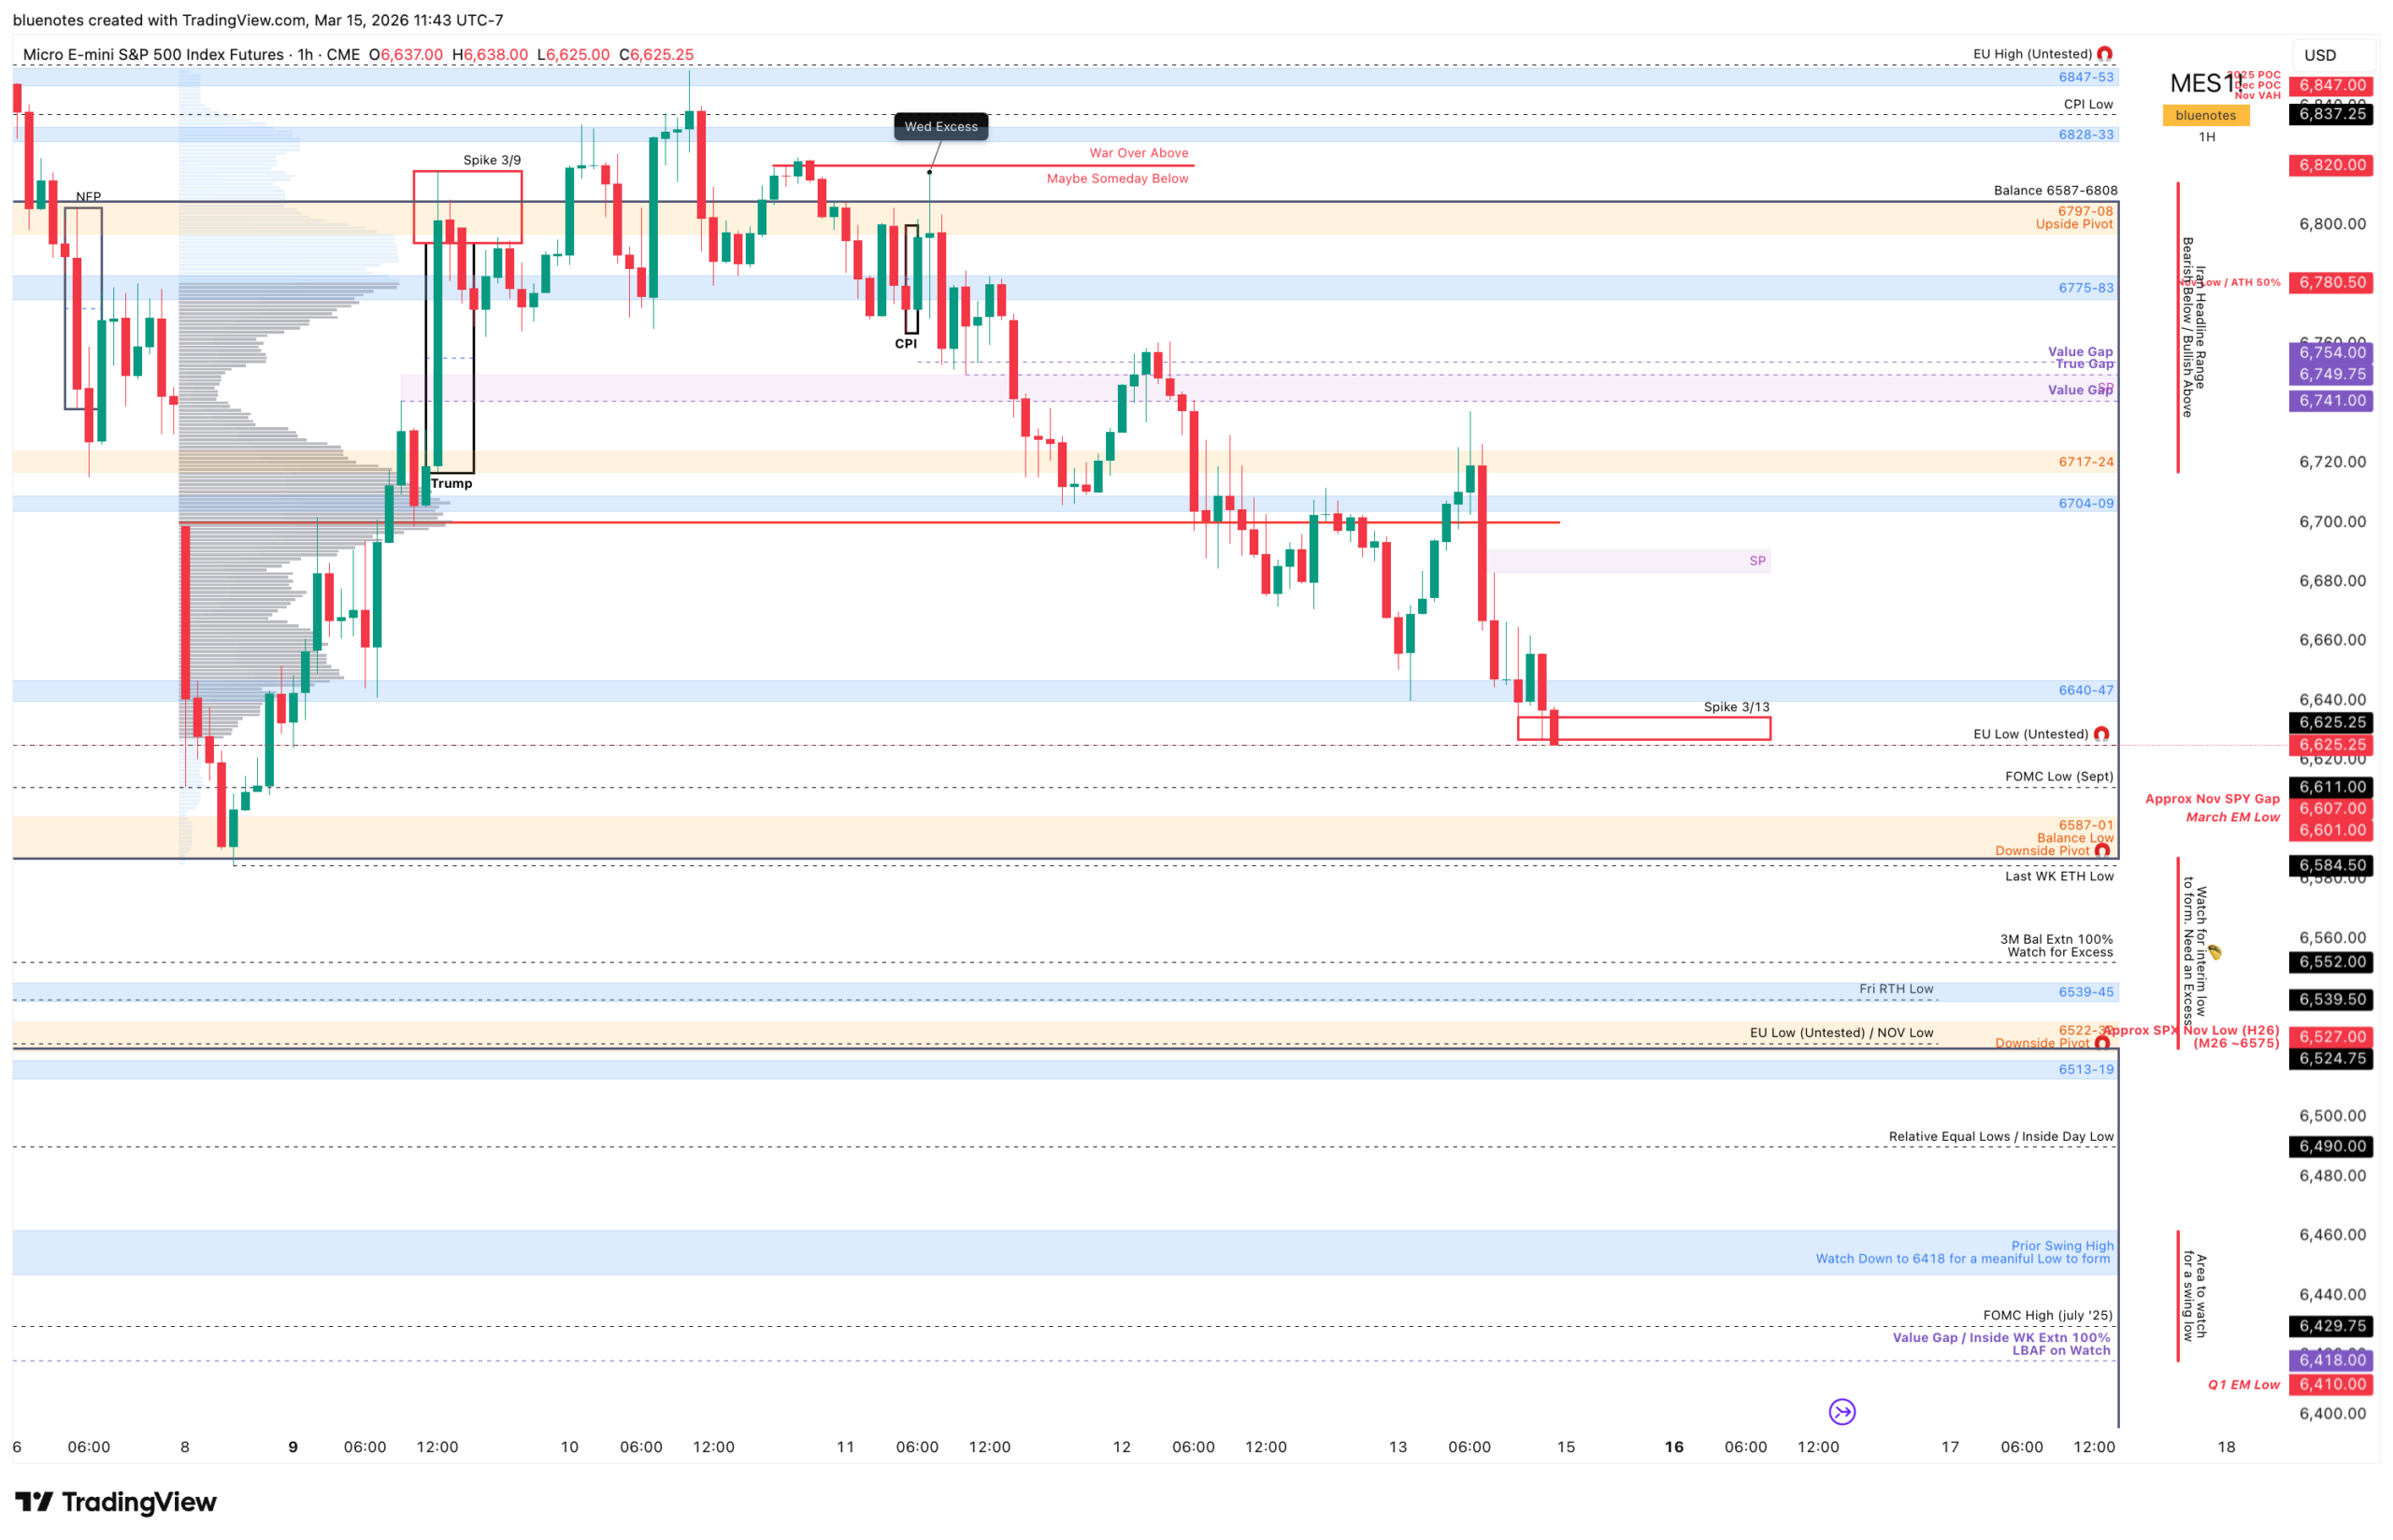
Structurally, I still plan to respect this area as a prospective 6+ month range low unless and until we break the November low with continuation. That remains the line in the sand for me. I also want to reiterate that below there, the market can open the door to a short-term disaster scenario. A number of technical indicators are now “oversold,” but I would be careful not to overstate that. NAAIM has finally come in below 70 for the first time in quite a while, but a reading of 66 is not remotely what I would call properly washed out. The risk of a larger capitulation move lower remains very real. That may sound bearish, but truthfully it is also the type of event this market has likely needed for some time. In the end, all that really matters remains the November low, which on SPX sits at 6522.
To the upside, 6741-6750 (6791-6800) is the most important level on the board. Friday’s RTH low came in at 6627 (6676.50), and the session ended with a spike at 6627-6634.5 (6676-6684). I tend to think the weekly 6640-6647 (6690-6697) level is more important than the spike itself, so that is where I’ll begin the week.
Trading Higher
Bullish trigger for the week is a failed breakdown and reclaim of 6640-6647 (6690-6697). We sold off a bit after the RTH close, which may validate the spike, but I would still be watching for a LBAF and recovery of that zone. If buyers can reclaim it, then the first order of business becomes the single print at 6683-6691 (6733-6741), which would fill Friday’s C period. If that area is reclaimed as well, bulls then earn the right to test the far more important single print and gap zone at 6741-6749.75 (6791-6800) from Monday’s Trump event candle. That is the key upside battleground for the week. I would absolutely monitor for a LAAF there, especially since reclaiming it would also fill multiple gaps, including two value gaps and the true gap. However, if ES accepts above that region, then at least two days of trapped sellers are left below, and that can fuel a meaningful squeeze.
Above there, sellers are generally fine as long as we remain below 6796-6808 (6847-6858), which marks the balance top and yearly level. They may also try to defend 6775-6783 (6825-6833), but if they do, they will need to force price back below 6741 (6791) fairly quickly to regain downside traction. If that does not happen, then the recovery starts to become more meaningful than just a bounce.
Trading Lower
Bearish trigger for the week remains simple as well: break below Friday’s low with continuation. If that occurs, then I would expect a test of the balance low at 6587-6601 (6637-6651), along with last Sunday’s overnight low at 6584.50 (6634.50). Below there, the focus shifts to rotation toward the lower balance and the November low at 6524.75 (6574.75). There are a few likely reactive spots between those balance ranges. 6552 (6602) is the 3-month 100% balance extension, while 6539-6545 (6589-6595) marks the November 21 RTH low. If weakness continues and price begins accepting back into the lower balance, then the broader downside target becomes 6462-6418 (6512-6468), where I would be looking for a meaningful low to begin forming.
This is also a week where I think flexibility matters more than conviction. We have contract roll, OPEX, and FOMC all packed into the same week, so I would expect a lot of back-and-forth trade and generally poor conditions for anyone trying to force a narrative too early. The expected move for the week is 214 points, with Monday’s expected range at 101 points, so there is more than enough room for both sides to get chopped up if they are not patient. Be sure to be moving to the June contracts no later than Wednesday.
ES Live Chart: https://www.tradingview.com/chart/f8EEzTyy/
ESM 2026 ranges. I’ve broken them into groups for easy plugging into the indicator against the shared chart.
Minor
6904 EU High (Untested)
6661 FOMC Low (Sept)
6602 3M Bal Extn 100%
6540 Rel EQ Lows
6589.50 Fri RTH Low
6574.75 EU Low (Untested) / Nov Lows)
6479.75 FOMC High (July)
6634.5 Last WK ETH Low
6577 ~SPX Nov Low
Major
6948-6952 ’26 Open
6897-6903 Recovery Above
6825-6833
6754-6759 Reclaim Level
6690-6697
6589-6595 Monitor LBAF
6563-6569 Monitor LBAF
6497-6512 Prior Swing High / Monitor LBAF
6396-6399
Structure
6936-6943 Intra Pivot
6847-6858 Upside Pivot
6767-6774 WK Pivot
6637-6651 Balance Low / Downside Pivot 🧲
6572-6582 Downside Pivot / Balance Top
6412-6427 Bal HB / FOMC Low / Demand
Other
6804 Value Gap
6799.75 True Gap
6791-6800 H26 SP
6733-6741 H26 SP
6657 ~SPY Gap
6468 Value Gap / Monitor LBAF