Markets have now entered a more fragile phase, and I do not think that should be minimized. ES has broken down through the bottom of the multi-month balance, and that is a meaningful technical development that deserves respect until proven otherwise. While the selloff may feel stretched and a relief rally could certainly develop at any time, I still see nothing in the action that suggests a true bottom is already in place. For now, the burden of proof remains on buyers. Until they can reclaim broken structure in a meaningful way, this continues to look like a damaged market that is vulnerable to further downside, even if that downside comes with sharp countertrend rallies along the way.
The broader downside target remains the next major yearly range at 6153-6239. That is the area I continue to view as the main destination if weakness persists and also the zone where a more meaningful swing low could potentially form. My lean is that while a bounce directly from here would not be surprising, trading lower first would more likely produce the kind of durable low worth respecting. Said differently, this still does not look like a market that has fully washed out. It may still need some form of capitulation before a better long opportunity presents itself.
One of the more important tactical points here is that testing higher first and then failing would actually be more bearish than simply continuing lower right away. That has been the pattern repeatedly, and I do not think this week would be any different. It is also why I think failed rallies remain one of the cleaner bearish signals in the current environment. At the same time, bear-trend rallies can be vicious, so I would be careful about getting overly aggressive on the short side once price starts pushing into larger support zones.
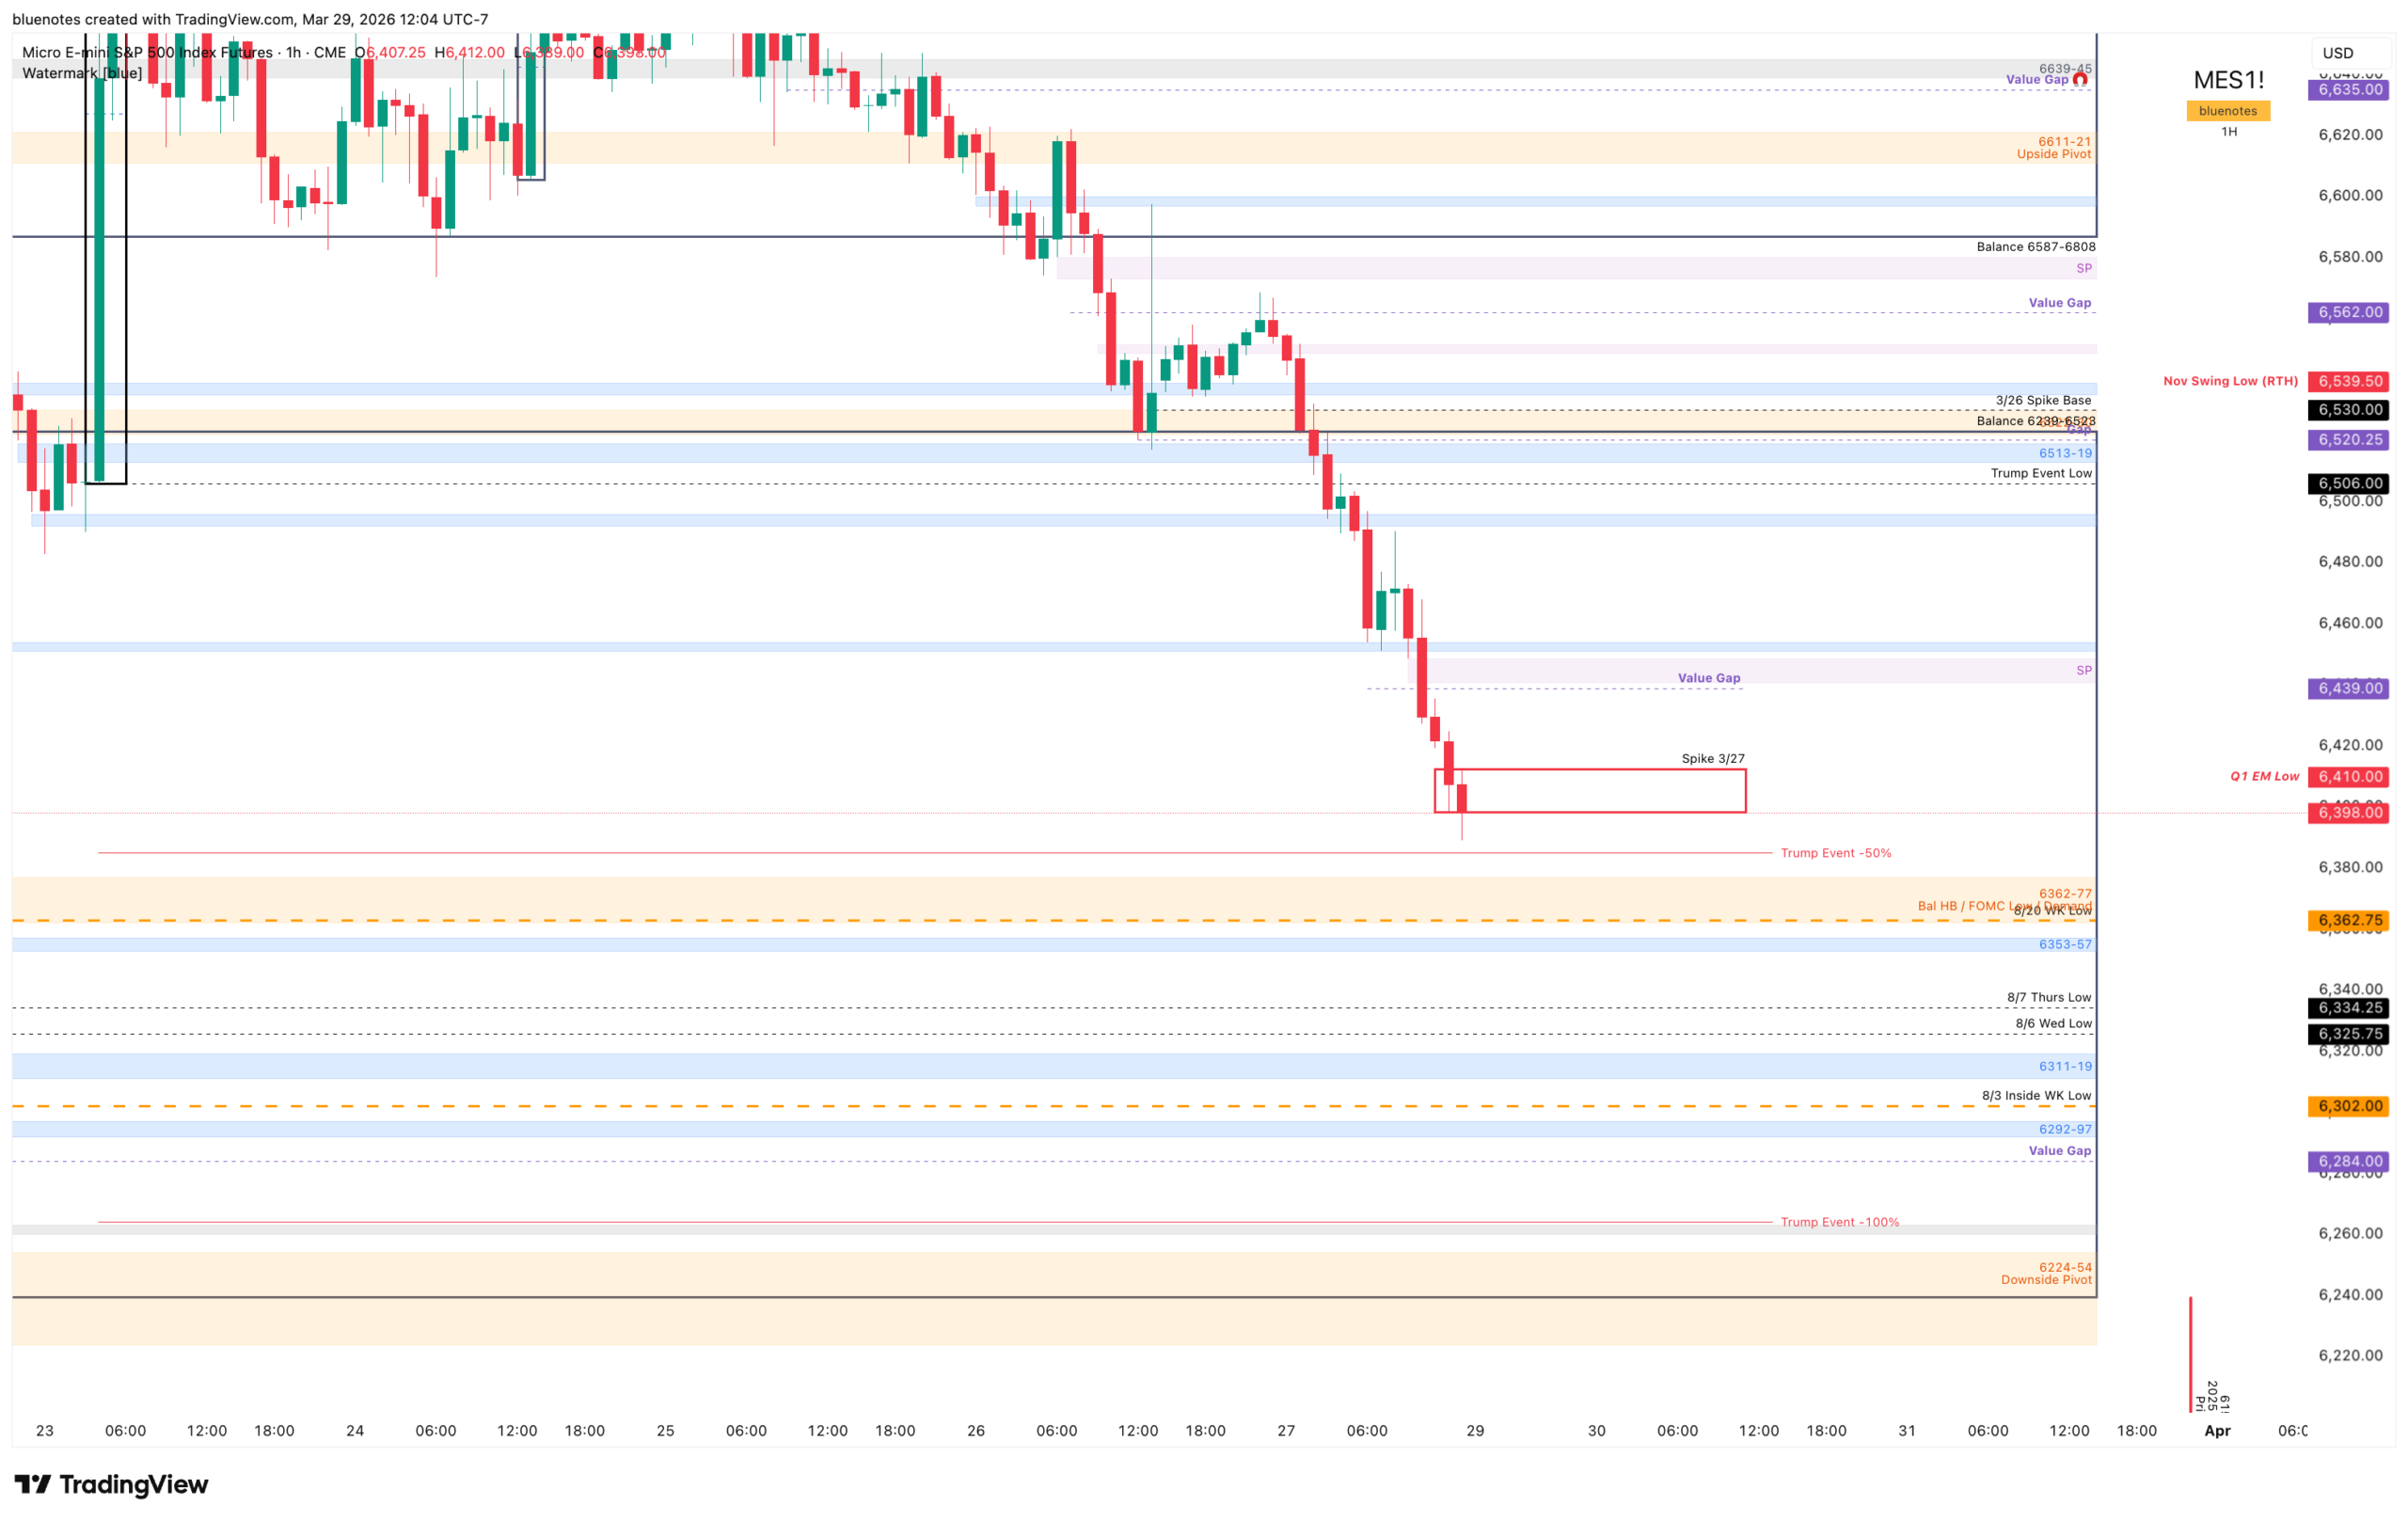
To the upside, the first meaningful bullish trigger is a reclaim of 6451-6454. While 6441 is the first test overhead (Single Print), I do not think there is much to trust on the upside unless 6451-6454 is firmly reclaimed and sustained (Friday IBL). If that happens, ES can likely rotate into Friday’s high and then into the bearish true gap at 6495.75-6520.25. That gap should be treated as resistance until proven otherwise, with 6492-6496 and 6513-6519 serving as the lower and upper edges of the key reclaim area.
If bulls can reclaim and hold above that gap, then the squeeze can extend into 6535-6539 (Nov RTH Low). Beyond that, the closer to 6562 (value gap), with potential for 6573-6580 (single print) if momentum really starts to build. Even so, I would remain cautious with longs in that area because a rally into broken structure can still simply become a lower high. Above there, 6597-6600 and 6618-6622 are important watch zones for any kind of failed reclaim or renewed rejection.
To the downside, there is less emphasis on precision and more emphasis on recognizing exhaustion. The levels specifically 6362-77, 6353-6357, and 6311-6319. But in a liquidation-style environment like this, exact levels matter less than identifying when sellers are finally starting to run out of momentum. The major destination remains 6153-6239, and if a credible swing low forms anywhere between current prices and that prior all-time-high backtest area, the plan would be to begin adding back some long exposure for longer-term accounts and then evaluate whether the backtest of the broken range holds or fails.
At this stage, I do not think the game is to predict the exact path. The game is to stay aligned with structure and avoid getting trapped in emotion after an already significant move. The market is technically broken, but also increasingly susceptible to violent countertrend trade. That means discipline matters more than conviction here. Respect the breakdown unless buyers prove otherwise. Respect the potential for a sharp relief rally, but do not confuse that with evidence of a durable low unless price starts reclaiming and holding the right areas. For now, the larger focus remains unchanged: monitor for failed rallies, watch for exhaustion lower, and keep the 6153-6239 yearly range in mind as the area most likely to matter if this liquidation continues.
ES Expected Move this week: 191pts
Grab the new expected move indicator and add the updated dataset to display the levels that are shown for all the products on the table into your TradingView chart for the coming week.