Some turbulence while I was away. The main objective since October 8 has been to clean up the ETH all-time high (6812.25). Since then, headlines around the “100-155%” China tariff — on, off, on again, handshakes, meetings planned, and so on — kept the market chopping inside the October 10 range. Yet through all that noise, we continued to print higher highs and higher lows, with each dip largely tied to reactionary selling or short-term liquidations.
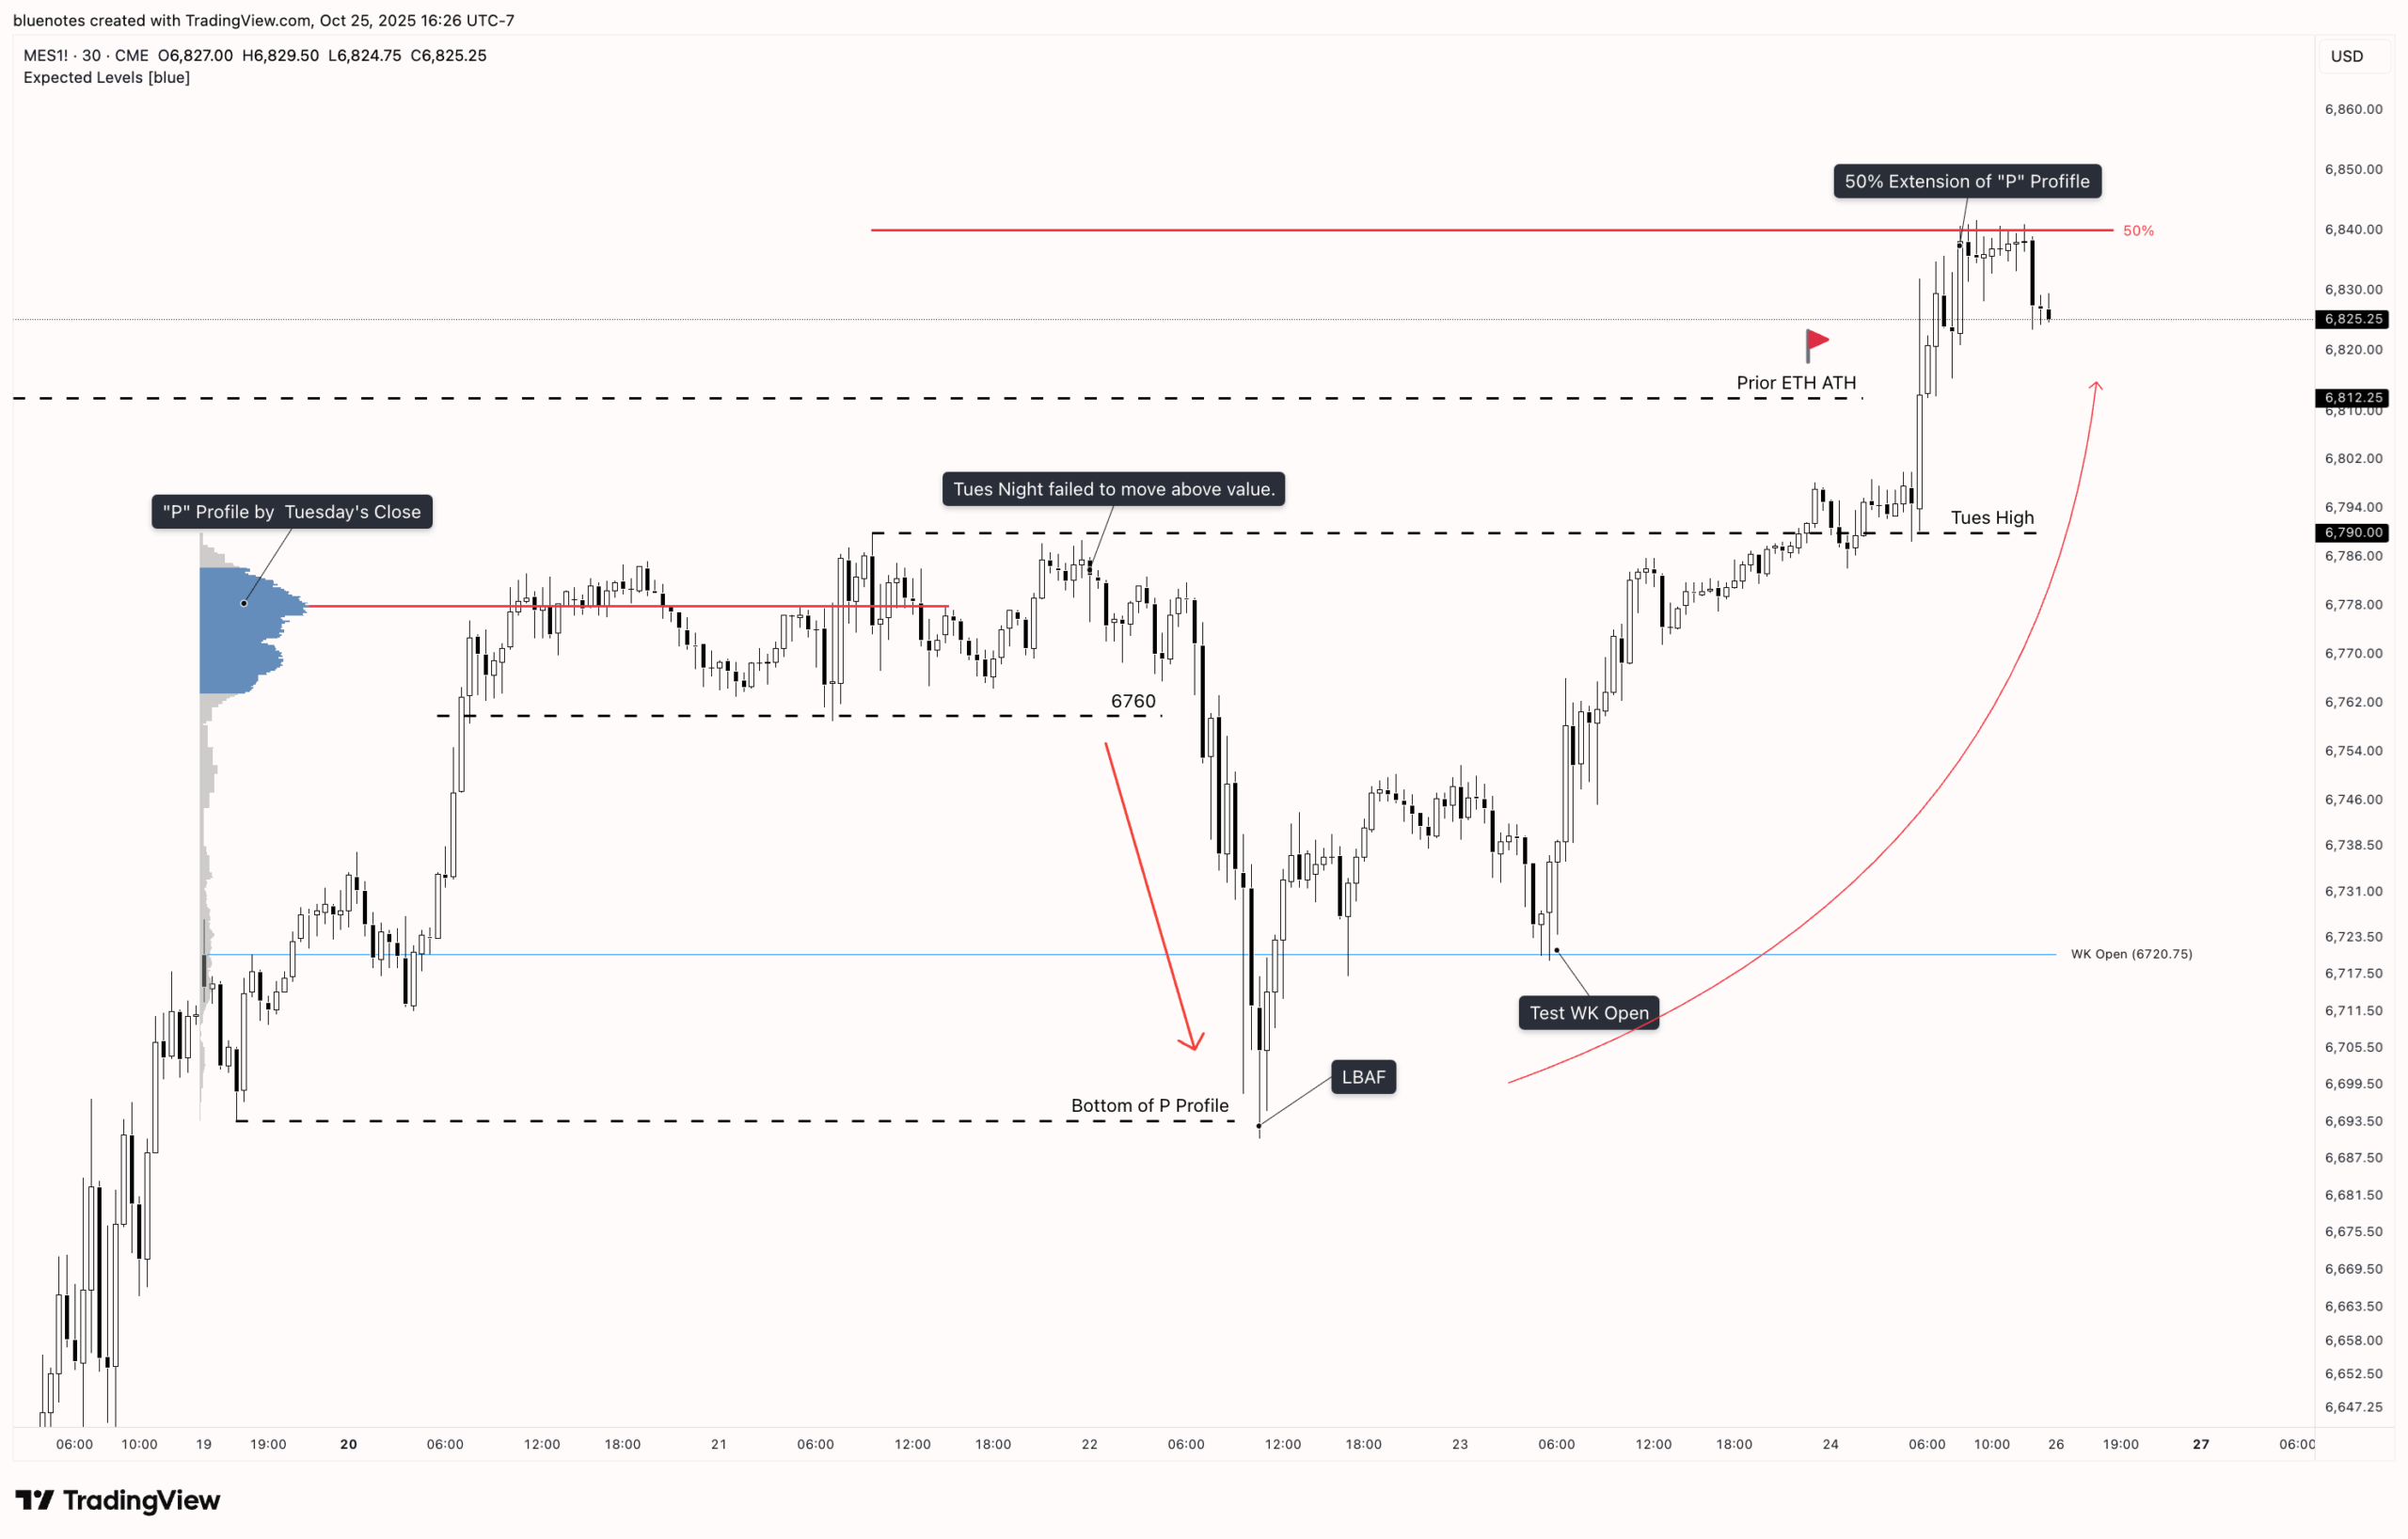
Last week began with a “P” profile on the weekly, which offered a clean sell setup. For context: when a “P” or lowercase “b” profile forms, the thin “shaft” often signals weak structure. If the upper portion of that “P” is deemed unfair value, price tends to revert back through that thin area in a “repair mission.” In this case, 6760 was the key line to hold, with single prints and a small gap fill just below.
Wednesday’s session confirmed that idea — the overnight high couldn’t push value higher, inviting sellers to target the bottom of the profile. That drop became a LBAF (Look Below and Fail) setup, reigniting the unfinished business to the upside and keeping the broader bullish trend intact.
Outlook for the Week Ahead
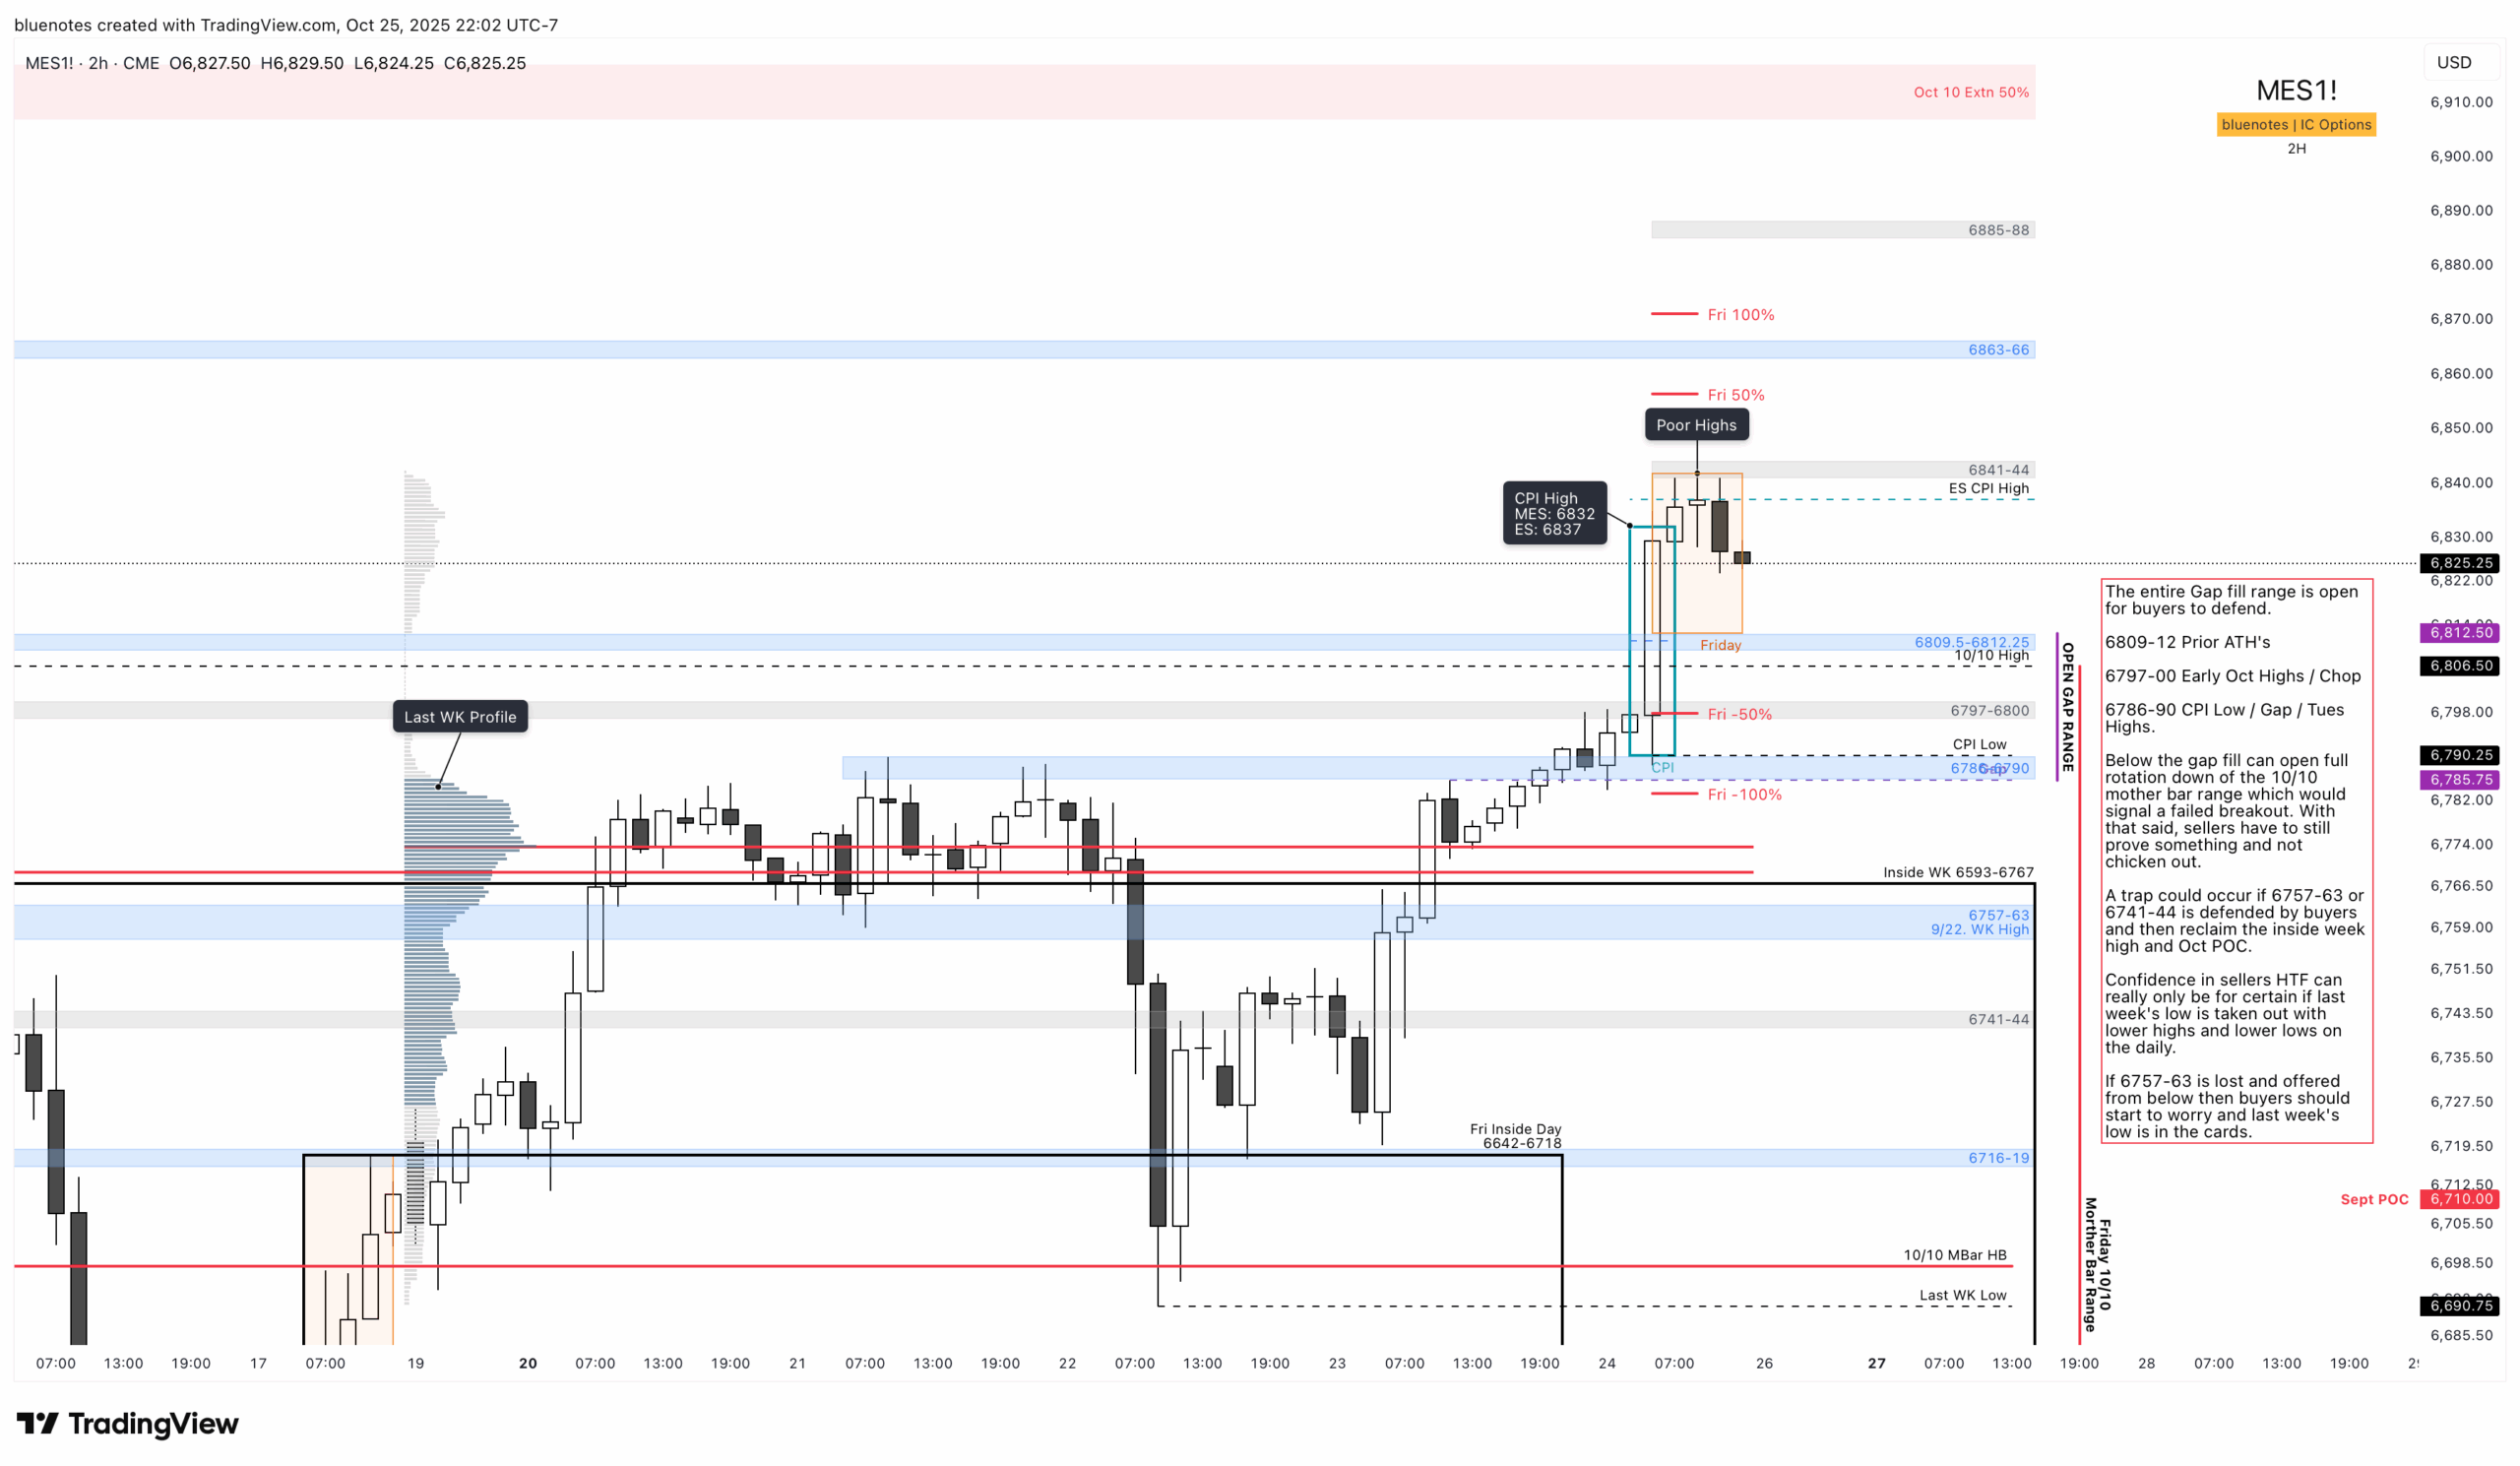
The initial focus for the week is on 6809.5-6812.25 — a confluence zone that includes Friday’s low, the prior ETH and RTH all-time highs, and the CPI halfback. The gap fill range below is wide, from 6785.75 to 6812.50. Friday’s low acted as a healthy back test, so bulls ideally want to see direct continuation higher early in the week.
Routine long zones of interest:
- 6809–6812: Prior ATHs
- 6797–6800: Early October highs / chop zone / Friday 50% extension
- 6786–6790: CPI low / gap fill / October 21 highs
Anything below these levels starts to look less favorable. Keep in mind that a failed breakout could pull price all the way back toward the October 10 “mother bar” low. That said, given the fresh RTH ATH and the consistent lack of seller follow-through lately, the benefit of the doubt still goes to the bulls.
Below the gap fill, I’d start to get more cautious — but would still watch for a reclaim and LBAF setup with October POC and last week’s POC, both potential support layers. A trap scenario could form if 6757–6763 or 6741–6744 is defended or quickly reclaimed, followed by a move back above the inside week high and October POC.
If 6757–6763 breaks and is accepted from below, buyers should be on alert — last week’s low would be back in play. This zone sits just under the inside week high and the 50% retracement of last week’s range, so it should attract at least an initial defense. If that holds, reclaiming 6786–6790 becomes the next priority, followed by Friday’s low.
Upside Scenarios
Friday’s high remains a poor high and should act as a magnet for cleanup. A LAAF (Look Above and Fail) is possible there; however, if the market accepts above or gaps up Monday, the long bias remains valid. We’re breaking out from both the five-week balance and the October 10 liquidation bar, so the broader tone still favors higher prices until proven otherwise.
Initial upside targets:
- 6856: 50% extension of Friday’s range
- 6871: 100% extension of Friday’s range
Main upside targets:
- 6907: 50% extension of October 10 “mother bar”. SPX equivalent: 6870
- 7018: 100% extension of October 10 “mother bar”. SPX equivalent: 6980
Side note: the SPX call wall currently sits near 7000, which aligns roughly with ES 7038. Should the market reach this area, expect increased hedging activity and potential for responsive selling or profit-taking. Between the 50/100% Oct 10th extensions rest the October expected move high 6975-6985.
Final Thoughts
We’re still operating within a broader uptrend on the weekly and monthly timeframes, and pullbacks continue to attract responsive buyers. As long as structure holds above key levels, liquidation breaks remain buying opportunities.
If sellers finally step in and produce a lower daily high followed by a lower low, that will mark a shift worth respecting. Until then, stay focused on structure and levels, manage bias, and take it step by step, level by level.
ES Live Chart: https://www.tradingview.com/chart/f8EEzTyy/